
Most common monitoring tools and techniques, including:
- Monitoring tools – looking briefly at Windows Performance Monitor and Red Gate SQL Monitor
- Using the Dynamic Management Objects - to investigate log activity at the server, file or database level
- Using T-SQL or PowerShell Scripting – to report log characteristics and usage across all servers
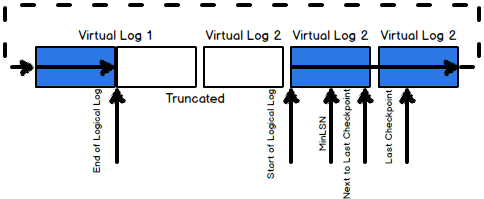
Every SQL Server transaction log is made of Virtual Log Files (VLFs). During the truncation process, only the Logical log is scanned. A Logical log is made of active VLFs. A Log Sequence Number (LSN) is used to uniquely identify every transaction in the online transaction log. The MinLSN is the starting point of the oldest active transaction in the online transaction log
The online SQL Server transaction log file is circular by internal organization. When logging reaches the end of the transaction log, it starts again from the beginning by overwriting the parts marked as inactive
Monitoring tools
Several tools are available that will, among other things, allow us to monitor activity on our database files, including the log. Here, we'll consider just two in brief; a built-in tool (Perfmon) and a third party tool (Red Gate SQL Monitor).
Windows Perfmon
A popular "built-in" tool for monitoring SQL Server activity is Windows Performance Monitor (Perfmon). It is a Windows OS monitoring tool that provides a vast range of counters for monitoring memory, disk I/O, CPU and network usage on a server (for example, seehttp://technet.microsoft.com/en-us/library/cc768048.aspx), and also exposes the counters maintained by SQL Server. Generally, the DBA or system administrator would set up Perfmon to record statistics from various counters at regular intervals, storing the data in a file and then importing it into Excel, or a similar tool, for analysis.
Amongst its many counters, it offers a number to measure disk read and write performance, as well as specific counters for log monitoring.
There are plenty of available tutorials on the use of Perfmon, and we won't repeat those in any detail here. In addition to documentation on TechNet (http://technet.microsoft.com/en-us/library/cc749249.aspx), we recommend the following articles for those new to this tool:
- SQL Server Perfmon Best Practices, by Brent OzarA comprehensive tutorial on use of the tools and recommended counters for monitoring SQL Server, how analyze the saved data in Excel.
http://www.brentozar.com/archive/2006/12/dba-101-using-perfmon-for-sql-performance-tuning/ - Correlating SQL Server Profiler with Performance Monitor, by BradMcGeheeA "quick start" tutorial on use of Perfmon, plus how to correlate Perfmon data with Profiler trace data.
http://www.simple-talk.com/sql/database-administration/correlating-sql-server-profiler-with-performance-monitor/ - Baselining and Benchmarking, by Brent OzarA video tutorial providing an overview of monitoring using Performance Monitor, Profiler, as well as and benchmarking whys and hows.
http://technet.microsoft.com/en-us/sqlserver/gg429821.aspx
In terms of the general performance of the disks housing the log (and data) files, we can monitor the following pairs of counters:
Physical Disk\Disk Reads/secandPhysical Disk\Disk Writes/sec– we need to know the values of these counters and, having established a baseline, look out for marked rises in either, and investigate their causePhysical Disk\Avg. Disk sec/ReadandPhysical Disk\Avg. Disk sec/Write– the average times (in ms) of a read and write to disk; these counters provide the disk latency stats that can be used to pinpoint potential I/O bottlenecks.
Popular guideline values for the disk latency counters suggest that less than 10 ms is "good", anything over 20-30 ms is "OK", but potentially worrying, and anything over about 50 ms indicates a possible I/O bottleneck. Of course, these figures are entirely dependent on the specification and configuration of the disk array in your environment.
For a very simple demo of Perfmon in action, we'll simply set it up to monitor counter activity for the
Physical Disk\Avg. Disk sec/Read and Physical Disk\Avg. Disk sec/Write counters whilst one of the databases is under a heavy write load.
For our examples, we're going to recreate anew version of the
Persons database and table from Level 8. In the code download for this level, the script Ch09_Persons.sql recreates the Persons database, in FULL recovery model, followed by the Persons table. It then populates the table with 1 million rows of data (from the AdventureWorks2008 database, though it will also work with AdventureWorks2012).
We can now start Windows Perfmon (just search for "perfmon" from the Start menu). If you just want to see an instant snapshot of certain activity, you can simply add counters directly to the Perfmon graph. However, if you wish to define a particular set on counters to monitor over time, on a schedule, then you'll need to define a new data collection set. Under Data Collector Sets, right-click on User Defined and selectNew | Data Collector Set (these data collector sets are unrelated to the SQL Server Data Collector mentioned in the introduction to this level).
Give your new Data Collector Set a name and choose whether to select the counters based on a pre-supplied template or manually (I chose the latter for this simple example). At the next screen, I opted to include only performance counter data, and at the one after, we get to select the performance counters.
Click Add…, type in the path to the appropriate server, hit the enter key and wait a few seconds (or longer, sometimes!) while it connects and populates the box below with the available counters. We can now go through and add the ones we want. On this occasion, we're only interested in the PhysicalDisk class, so click on it to expand it and select the relevant counters.
Notice that we're monitoring the counters for two separate disk drives (the data file for the
Persons database is on the C:\ drive and the log file on the D:\ drive), rather than capturing the total values for all drives. If both of these files are on the same drive, on your test machine, then you can simply collect the counters for the appropriate single drive.

Figure 9.1: Setting up Perfmon
Having clicked OK, we return to the previous screen and simply need to confirm the collection interval (this will vary depending on what you're monitoring; I just chose one second for this simple example) and click Finish.
We can run this new data collection set on a schedule, of course, but here we'll simply right-click on it and select Start (after a second or two a green "play" symbol will appear). Back in SSMS, we create a reasonably heavy write load on our
Persons database, as shown in Listing 9.1.USE Persons GO DECLARE @cnt INT; SET @cnt = 1; -- may take several minutes; reduce the number of loops, if required WHILE @cnt < 6 BEGIN; SET @cnt = @cnt + 1; UPDATE dbo.Persons SET Email = LEFT(Email + Email, 7000) END;
Listing 9.1: Updating the
Persons table
Once the code complete, return to Perfmon, right-click on your data collector set and stop the data collection. Navigate to the Reports menu item and under User Defined you should find a list of reports, with names of the form ClientName_Date_Number. Locate the relevant report and double click on it to view the data in graphical form, as shown in Figure 9.2.

Figure 9.2: A snapshot of disk read and write activity, using PerfMon
You can select and deselect the counters you wish to display, and by double-clicking on any one, in the counter listing below the graph, you can modify their appearance on the graph, the scale and so on. You can also zoom into an area of the graph by clicking on the graph and dragging across to highlight the required area and then clicking the magnifying glass from the top menu (use the horizontal scroll bar directly below the graph to zoom back out).
The dominant activity on the graph is disk writes to the D: drive, hosting our log file. We can see that for periods, the latency sites at around 40 ms, but with frequent higher spikes. We can use the Change Graph type icon from the top menu to view a report. Over the entire collection period, the report shows an average latency for writes to the D: drive of 55 ms, which could be a cause for concern if seen for sustained periods. Of course, many other PhysicalDisk counters, and other counters, are available that can offer insight into the underlying performance of your disks
(%DiskTime, DiskTransfers/sec and so on), and we should undertake a deeper analysis before jumping to conclusions.
In addition, and in a similar manner, we could collect other log-related counters, such as those available in the
SQL Server:Databases. This object offers various counters for investigation of log activity, including among others (see: http://msdn.microsoft.com/en-us/library/ms189883.aspx):Log File(s) Size (KB)andLog File(s) Used Size (KB)– total size of transaction log and how much is currently being usedLog Flushes/secandLog Bytes Flushed/sec– number and size of writes from log cache to disk
Red Gate SQL Monitor
If you use a third party SQL Server monitoring tool, it is highly likely that it will collect, and store for analysis, many of these counter values. Figure 9.3 shows
Log File(s) Size values, in Red Gate's SQL Monitor tool, as the log file for the Persons database undergoes rapid growth, because of an incorrectly sized and configured log.
Figure 9.3: Rapid log growth, as reported by SQL Monitor
A nice feature of SQL Monitor is that it makes it very easy, much easier than with Perfmon, to compare the same type of activity across different periods. In the Time range dropdown, we can change the time range, set a custom range, as well as compare values for this metric from today (or "this week") to those captured yesterday (or "last week"), and so on.
Dynamic Management Views and Functions
Many DMVs (the generic acronym commonly used to refer collectively to Dynamic Management Views and Functions) offer insight into how the SQL Server engine uses the disk I/O subsystem, and the ability of that subsystem to cope with the I/O throughput and performance demanded by the system workload. For example:
sys.dm_io_virtual_file_stats– provides statistics on utilization of all database data and log files. It is an excellent resource for discovering hot spots, and identifying opportunities to spread I/O over different channelssys.dm_io_pending_io_requests– provides a list of all I/O operations that SQL Server is currently waiting to complete
Dropping down to the operating system level, the "
sys.dm_os_" category of DMVs provides a vast amount of detailed data regarding the nature of the interaction between SQL Server and the operating system. This gives us insight into how the workload represented by the submitted requests translates into actual work in the operating system. Notably, the sys.dm_os_wait_stats records the length of time waited, and the requested resource, every time a session has to wait before proceeding with its work. It's a very useful DMV for finding out what is causing sessions to wait, including, of course, I/O waits.
The "
sys.dm_os_" category of DMVs also provides sys.dm_os_performance_counters, which exposes the performance counters, and therefore the "queues" in our system. Via specific resource measurements such as disk writes/sec, processor queue lengths, available memory, and so on, it helps us pinpoint the places where there is a lot of demand for a given resource, and the reasons for the excessive demand.
Up at the database level, SQL Server 2012 adds the
sys.dm_db_log_space_usage DMV, providing a very simple means to retrieve basic transaction log size and space usage data, similar to that returned by DBCC SQLPERF(LOGSPACE).
Here, we'll examine just three examples, starting with
sys.dm_db_log_space_usage and then moving on tosys.dm_io_virtual_file_stats and then sys.dm_os_performance_counters, to expose detailed information on log activity and growth.Using sys.dm_db_log_space_usage (SQL Server 2012 only)
If you're using SQL Server 2012 already, then getting basic log size and space information is very easy, as shown in Listing 9.2. We ran this code on a
Persons2012 database, identical to Persons, except for the name.SELECT DB_NAME(database_id) AS DatabaseName , database_id , CAST(( total_log_size_in_bytes / 1048576.0 ) AS DECIMAL(10, 1)) AS TotalLogSizeMB , CAST(( used_log_space_in_bytes / 1048576.0 ) AS DECIMAL(10, 1)) AS LogSpaceUsedMB , CAST(used_log_space_in_percent AS DECIMAL(10, 1)) AS LogSpaceUsedPercent FROM sys.dm_db_log_space_usage;

Listing 9.2: Log size and space used
Using sys.dm_io_virtual_file_stats
For each database file that SQL Server uses, data files as well as log (and full text) files, the
sys.dm_io_virtual_file_stats function gives cumulative physical I/O statistics, indicating how frequently the file has been used by the database for reads and writes, since the server was last rebooted. It also provides a very useful metric in the form of the "I/O stall" time, which indicates the total amount of time that user processes have waited for I/O to be completed, on the file in question. Note that this DMV measures physical I/O only. Logical IO operations that read from cached data will not show up here. The function accepts a database_id and a file_id, which we can use to investigate specific files or databases, or we can simply return the data for all files on the server.
In order to start with a clean slate, rerun the script Persons.sql to drop and recreate the
Persons database and table, and populate it with 1 million rows and then run Listing 9.3 to capture into a temporary table some baseline data for the server.SELECT DB_NAME(mf.database_id) AS databaseName , mf.physical_name , divfs.num_of_reads , divfs.num_of_bytes_read , divfs.io_stall_read_ms , divfs.num_of_writes , divfs.num_of_bytes_written , divfs.io_stall_write_ms , divfs.io_stall , size_on_disk_bytes , GETDATE() AS baselineDate INTO #baseline FROM sys.dm_io_virtual_file_stats(NULL, NULL) AS divfs JOIN sys.master_files AS mf ON mf.database_id = divfs.database_id AND mf.file_id = divfs.file_id
Listing 9.3: Capturing baseline disk I/O statistics from
sys.dm_io_virtual_file_stats in a temporary table
Listing 9.4 shows a query against the
#baseline table, returning some the read and write statistics for the Person database.SELECT physical_name , num_of_reads , num_of_bytes_read , io_stall_read_ms , num_of_writes , num_of_bytes_written , io_stall_write_ms FROM #baseline WHERE databaseName = 'Persons'

Listing 9.4: Querying the
#baseline temporary table
As noted, the data provided by this function is cumulative from when the server last restarted; in other words, the values in the data columns increment continuously, from the point when the server was last restarted. As such, a single "snapshot" of the data is rather meaningless, on its own. What we need to do is take a 'baseline' measurement, wait for a set period, perhaps while a specific set of operations complete, then take a second measurement and subtract the two, so that you can see where I/O is "accumulating".
Re-run Listing 9.1 to update our
Persons table, and run Listing 9.5 to collect a second set of data and subtract the baseline data values (we omit a few columns from the output purely due to space constraints).WITH currentLine AS ( SELECT DB_NAME(mf.database_id) AS databaseName , mf.physical_name , num_of_reads , num_of_bytes_read , io_stall_read_ms , num_of_writes , num_of_bytes_written , io_stall_write_ms , io_stall , size_on_disk_bytes , GETDATE() AS currentlineDate FROM sys.dm_io_virtual_file_stats(NULL, NULL) AS divfs JOIN sys.master_files AS mf ON mf.database_id = divfs.database_id AND mf.file_id = divfs.file_id ) SELECT currentLine.databaseName , LEFT(currentLine.physical_name, 1) AS drive , currentLine.physical_name , DATEDIFF(millisecond,baseLineDate,currentLineDate) AS elapsed_ms, currentLine.io_stall - #baseline.io_stall AS io_stall_ms , currentLine.io_stall_read_ms - #baseline.io_stall_read_ms AS io_stall_read_ms , currentLine.io_stall_write_ms - #baseline.io_stall_write_ms AS io_stall_write_ms , currentLine.num_of_reads - #baseline.num_of_reads AS num_of_reads , currentLine.num_of_bytes_read - #baseline.num_of_bytes_read AS num_of_bytes_read , currentLine.num_of_writes - #baseline.num_of_writes AS num_of_writes , currentLine.num_of_bytes_written - #baseline.num_of_bytes_written AS num_of_bytes_written FROM currentLine INNER JOIN #baseline ON #baseLine.databaseName = currentLine.databaseName AND #baseLine.physical_name = currentLine.physical_name WHERE #baseline.databaseName = 'Persons' ;

Listing 9.5: Capturing disk I/O statistics, since the baseline measurement
Cleary we forced some very heavy write activity on the log file in this example! Generally, though, pinpointing the cause of high IO stalls, and resolving the problem, is sometimes a complex process. If you suspect that I/O stall rates are causing issues, then the first course of action might be attempt to reduce the overall I/O load to acceptable levels. For example, we can use data from the execution- and index-related DMVs to attempt to reduce the overall I/O load on the server through tuning and indexing. We could also increase the amount of RAM, so that more data can be held in the data cache, and so reducing the occurrence of physical file reads. Armed with I/O stall rate, and the amount of data read and written, we can also identify opportunities to implement partitioning, or to at least separate tables onto different filegroups.
Ultimately, however, high stall rates could simply indicate that the disk I/O subsystem is inadequate to handle the required I/O throughput. If attempts to reduce the overall I/O load fail to bring them down to acceptable levels, then there is little choice but to consider adding more or faster disks, more or faster IO paths, or to investigate potential problems with the configuration of the I/O subsystem.
Finally, remember that the data in this DMV reflects only SQL Server's perspective of disk I/O. If the disk subsystem is shared, at a server level, with other applications, another application may be the actual cause of poor disk performance, not SQL Server. Furthermore, with use of SANs, virtualization software, and so on, there are often several "intermediary" layers between SQL Server and the actual disk storage.
In short, analyze carefully the data obtained from this DMV, and consider it in conjunction with data obtained from Windows OS counters, Profiler, and other DMVs, before deciding on a course of action.
Using sys.dm_os_performance_counters
Generally, it's probably easiest to collect performance counters using Performance Monitor (PerfMon), as discussed previously. However, if you prefer to save the statistics in a database table and interrogate them using SQL, the
sys.dm_os_performance_counters DMV is a very useful tool. Just write the query to retrieve the data from the DMV, add INSERT INTO CounterTrendingTableName… and you have a rudimentary monitoring system! In addition, it's not always possible to get direct access to PerfMon, and accessing it from a different machine can be slow.
Unfortunately, using this DMV is far from plain sailing and a full description of its intricacies is out of scope here. Instead, we refer you to the book Performance Tuning using SQL Server Dynamic Management Views (http://www.simple-talk.com/books/sql-books/performance-tuning-with-sql-server-dynamic-management-views/), which is available as a free eBook.
Listing 9.6 simply provides an example of how to report on log growth or shrink events.
DECLARE @object_name SYSNAME
SET @object_name = CASE WHEN @@servicename = 'MSSQLSERVER' THEN 'SQLServer'
                        ELSE 'MSSQL$' + @@serviceName
                   END + ':Databases'

DECLARE @PERF_COUNTER_LARGE_RAWCOUNT INT
SELECT  @PERF_COUNTER_LARGE_RAWCOUNT = 65792

SELECT  object_name ,
        counter_name ,
        instance_name ,
        cntr_value
FROM    sys.dm_os_performance_counters
WHERE   cntr_type = @PERF_COUNTER_LARGE_RAWCOUNT
        AND object_name = @object_name
        AND counter_name IN ( 'Log Growths', 'Log Shrinks' )
        AND cntr_value > 0
ORDER BY object_name ,
        counter_name ,
        instance_name

Listing 9.6: Capturing log growth and shrink events
The output indicates that the
Persons database (initial log size 2MB, auto-growth increment 2MB) underwent a huge number of log growth events, due to inserting the initial load of 1 million rows and then performing the update in Listing 9.2. This is obviously a cause for concern and the DBA would need to investigate the log sizing and growth settings, and possibly performing a one-off shrink followed by appropriate resize, as described in Level 8.T-SQL and PowerShell Scripting
There are several scripting approaches to monitoring all of your SQL Server instances for the size and properties of your database files, among many other things. This section doesn't attempt to cover all of the possible ways to collect this information, just to review the best ones of which we're aware.
T-SQL and SSIS
In his book, SQL Server Tacklebox (http://www.simple-talk.com/books/sql-books/sql-server-tacklebox/) Rodney Landrum provides T-SQL scripts to collect all manner of server and database information, including log and data file growth:
- Server Information – Server name, SQL Server version, collation information, and so on
- Database Management – Primarily to monitor data and log file growth
- Database Backups – Have backups run successfully? Which databases are in Full recovery mode versus Simple or Bulk-Logged? Are we doing regular log backups of Full recovery databases?
- Security – Who has access to do what?
- SQL Agent Jobs – Which could include those that run your database backups
He then demonstrates how to automate the collection of this information, across all servers, using SSIS, and store it in a central DBA Repository database, for review and analysis.
If this sounds like the right approach for you, download the free eBook, and accompanying code, and try it out.
PowerShell
PowerShell, with Server Management Objects, form a powerful automation tool for managing and documenting SQL Server databases. It's a rather steep learning curve for any DBA brought up on T-SQL and GUI management tools, but a few short scripts can gather all manner of data across all your servers, and all SQL Server versions.
The following two scripts are adapted from the work of PowerShell enthusiast Phil Factor; see http://www.simple-talk.com/sql/database-administration/powershell-smo-just-writing-things-once/.
The PowerShell routine in Listing 9.7 takes a list of SQL server instance names and checks all the databases within those servers instances, listing out, via SMO, the:
- Name of the log file and the path
- Auto-growth setting (either KB or percent)
- Current file size(MB), amount of space used(MB) and maximum file size (MB)
- Number of Disk Reads, Number of Disk Writes
- Bytes Read From Disk and Bytes Written To Disk
Simply update the script with your server name and run it from Windows PowerShell.
#Load SMO assemblies
$MS='Microsoft.SQLServer'
@('.SMO') |
     foreach-object {
        if ([System.Reflection.Assembly]::LoadWithPartialName("$MS$_") -eq $null)
           {"missing SMO component $MS$_"}
     }
set-psdebug -strict
$ErrorActionPreference = "stop" # you can opt to stagger on, bleeding
                                # if an error occurs

$My="$MS.Management.Smo"
@("YourServerPath\InstanceName","MySecondServer") |
   foreach-object {new-object ("$My.Server") $_ } | # create an SMO server object
    Where-Object {$_.ServerType -ne $null} | # did you positively get the server?
      Foreach-object {$_.Databases } | #for every server successfully reached
        Where-Object {$_.IsSystemObject -ne $true} | #not the system objects
          foreach-object{$_.Logfiles} |
           Select-object @{Name="Server"; Expression={$_.parent.parent.name}},
                         @{Name="Database"; Expression={$_.parent.name}},
                         Name, Filename,
                         @{Name="Growth"; Expression={"$($_.Growth)
                                                                                     $($_.GrowthType)"}},
                         @{Name="size(mb)"; Expression={"{0:n2}" –f
                                                                                   ($_.size/1MB)}},
                         @{Name="MaxSize(mb)"; Expression={"{0:n2}" –f
                                                                                     ($_.MaxSize/1MB)}},
                         NumberOfDiskReads,NumberOfDiskWrites,
                         BytesReadFromDisk,BytesWrittenToDisk |
               Out-GridView

Listing 9.7: Using PowerShell and SMO to investigate log file size, location and activity.
We've displayed the output in the grid view, and filtered to show only databases with the term "persons" in their name. If you'd prefer to output to Excel, simply replace
Out-GridView with the following:Convertto-csv –useculture > Export.csv
If you want run the script from within SSMS, right-click on the server or database and select Start PowerShell. If you're using anything other than the SQL 2012 version, then you'll need to first download, import and install the
sqlps module, in order to get access to the Out-GridView and Convertto-csv cmdlets. See Michael Sorens' article for more details: http://www.simple-talk.com/sql/database-administration/practical-powershell-for-sql-server-developers-and-dbas-%E2%80%93-part-1/. Alternatively, simply replace the last line withFormatTable.
Listing 9.8 shows a second routine, concerned with investigating log file fragmentation. Again, the routine uses SMO to query each database on all specified SQL Server instances. It queries
DBCC LogInfo, via T-SQL, to get the number of VLFs for each log file. It groups the results to report the number of virtual log files, the size of the biggest VLF in MB, the smallest VLF in MB, and average and total size across all VLFs, for each database. This time, we use FormatTable for the output.#Load SMO assemblies $MS='Microsoft.SQLServer' @('.SMO') | foreach-object { if ([System.Reflection.Assembly]::LoadWithPartialName("$MS$_") -eq $null) {"missing SMO component $MS$_"} } set-psdebug -strict $ErrorActionPreference = "stop" # $My="$MS.Management.Smo" # @("YourServerPath\InstanceName","MySecondServer") | foreach-object {new-object ("$My.Server") $_ } | # create an SMO server object Where-Object {$_.ServerType -ne $null} | # did you positively get the server? Foreach-object {$_.Databases } | #for every server successfully reached Foreach-object { #at this point you have reached the database $Db=$_ $_.ExecuteWithResults(‘dbcc loginfo’).Tables[0] | #make the DBCC query Measure-Object -minimum -maximum -average -sum FileSize | #group the results by filesize Select-object @{Name="Server"; Expression={$Db.parent.name}}, @{Name="Database"; Expression={$Db.name}}, @{Name="No.VLFs"; Expression={$_.Count}}, @{Name="MaxVLFSize(mb)"; Expression={"{0:n2}" –f ($_.Maximum/1MB)}}, @{Name="MinVLFSize(mb)"; Expression={"{0:n2}" –f ($_.Minimum/1MB)}}, @{Name="AverageVLF(mb)"; Expression={"{0:n2}" –f ($_.Average/1MB)}}, @{Name="SumVLF(mb)"; Expression={"{0:n2}" –f ($_.Sum/1MB)}} } | Format-Table * -AutoSize

Listing 9.8: Investigating Log Fragmentation with PowerShell and SMO (server name omitted from output)
Ref:
http://www.sqlservercentral.com/stairway/73776/
No comments:
Post a Comment