
SSRS
Article 1:
SSRS Overview
SQL
Server Reporting Services Overview
I would like to start from
SSRS overview.
Microsoft SQL Server 2008 Reporting Services provides a complete, server-based platform designed to support a wide variety of reporting needs enabling organizations to deliver relevant information wherever needed across the entire organization.
Microsoft SQL Server Reporting Services (SSRS) is an enterprise reporting platform which supports traditional reports and interactive reports delivered over the Web or through custom applications. SSRS is data-source independent. In SSRS, Multi-dimensional data sources (Cubes) can also be used.
Using SSRS, reports can be exported in a variety of formats, including Excel worksheets and Portable Document Format (PDF) files.
Also reports can be scheduled to deliver through mail on scheduled dates to selected audiences.
Reports can be published to Report Server (http://ReportServer/reports) and accessed through browser.
The server component in SSRS is managed through a Web services infrastructure accessible using Simple Object Access Protocol (SOAP). The client consuming the report might be as simple as a Web browser pointing to a Report Server URL. Reporting Services also has an API that allows reports to be embedded in other applications
SSRS 2008 New features
Following are the important New Features in SSRS 2008:
- Reports can be build from different data sources e.g. SQL Server, Oracle, DB2, SQL Azure, PowerPoint Workbooks, SAP NetWeaver BI, Hyperion Essbase, and others.
- Better reports visualization by viewing data graphically, leveraging a wealth of new rich mapping, gauge and charting capabilities. SSRS 2008 support for maps and geospatial visualizations with integration to Bing maps and support for SQL spatial data types
- Additional visualizations including indicators, sparklines and data bars
- Support for consuming SharePoint lists and PowerPivot models as data sources.
- Support for Madison and SQL Azure data sources
- Render any report as a data source to PowerPivot or other applications through ATOM data feeds.
- New data representation format of TABLIX control which has features of both Table and Matrix. We can use a tabular format for fixed data reports and Matrix format for dynamic crosstab reports; or combine the two formats by using the Tablix.
Reference:
BOL. Click here
for more information about new features of SQL Server 2008 Reporting Services.
Types of SSRS Reports
We can create different kind of reports using Reporting
Services. This article describes the terminology used for the various
types of reports and the ways reports can be created and then used. A
single report can have multiple characteristics e.g. snapshot reports can be
parameterized, ad hoc reports incorporate clickthrough report, and subreports
can be linked reports.
With Reporting Services, we can create following types of reports:
With Reporting Services, we can create following types of reports:
- Parameterized reports
- Linked reports
- Snapshot reports
- Cached reports
- Ad hoc reports
- Drilldown reports
- Drillthrough reports
- Subreports
Parameterized reports:
A parameterized report uses input parameter to complete report processing. With
a parameterized report, you can filter report data based on the values that are
set at run time. Parameterized reports are frequently used for filtering
reports data.
Linked reports: A linked report is a report that provides an access to an existing report. It is similar to a hiperlink that we use to open a page. A linked report is derived from an existing report and retains the original report definition. We can create a linked report on the report server when we want to create additional versions of an existing report. We can create linked reports whenever we want to deploy an existing report with different settings.
Snapshot reports: A snapshot report contains query results that were retrieved at a specific time. Unlike on-demand reports, which get up-to-date query results when we run the report, snapshots reports are processed on a schedule and then saved to Report Server. When we select a report snapshot to view, Report Server retrieves the stored report from the report server database and shows the data and layout that were captured for the report at the time the snapshot was created.
Report snapshots serve three purposes:
- Report history - by creating a series of report snapshots, we can build a history of a report that shows data changes over time.
- Consistency - use report snapshots when you want to provide consistent results for multiple users who must work with identical sets of data. With volatile data, an on-demand report can produce different results from one minute to the next.
- Performance - by scheduling large reports to run during off-peak hours, we can reduce processing impact on the Report Server during core business hours.
Cached reports: A
cached report is a saved copy of a processed report. These reports are used to
improve performance by reducing the number of processing requests to the report
processor and by reducing the time required to retrieve large reports.
Ad hoc reports: An ad hoc report can be created from an existing Report Model using Report Builder. Ad hoc reports refer specifically to Report Builder reports. Ad hoc reports leverage report models and pre-defined templates to enable information workers to quickly and easily explore business data using familiar terminology and data structures that have been implemented in the report model. Ad hoc reports can be saved and run locally or published to a report server, just like other Reporting Services reports.
Drilldown reports: Drilldown reports initially hide complexity and enable the user to toggle conditionally hidden report items to control how much detail data they want to see. Best example of Drilldown report is Sale information for the Year, then drill down for Quarters followed by Months and week. Other example is Sale by Region then drilldown by Countries followed by State and Cities.
Drillthrough reports: Drillthrough reports are standard reports that are accessed through a hyperlink on a report item in the original report. Drillthrough reports work with a main report and are the target of a drillthrough action for a report item such as placeholder text or a chart. The main report displays summary information, for example in a matrix or chart. Actions defined in the matrix or chart provide drillthrough links to reports that display greater details based on the aggregate in the main report. Drillthrough reports can be filtered by parameters.
Subreports: A subreport displays another report inside the body of a main report. A subreport is used to embed a report within another report. Any report can be used as a subreport. The subreport can use different data sources than the main report. We can set up the parent report to pass parameters to the subreport. Although a subreport can be repeated within data regions using a parameter to filter data in each instance of the subreport, subreports are typically used with a main report as a briefing book or as a container for a collection of related reports.
|
SQL Server Reporting Services
(SSRS)
(Introduction) |
|
Overview
SQL Server Reporting Services 2008 (SSRS) is a feature included in the SQL Server 2008 product. We use SSRS to design, develop, test, and deploy reports. SSRS was originally slated to be released with SQL Server 2005 but it wound up being released a little bit ahead of SQL Server 2005. SSRS leverages the Business Intelligence Development Studio (BIDS) developer tool for all aspects of authoring and deploying reports. BIDS is included with SQL Server 2008.
SQL Server Reporting Services 2008 (SSRS) is a feature included in the SQL Server 2008 product. We use SSRS to design, develop, test, and deploy reports. SSRS was originally slated to be released with SQL Server 2005 but it wound up being released a little bit ahead of SQL Server 2005. SSRS leverages the Business Intelligence Development Studio (BIDS) developer tool for all aspects of authoring and deploying reports. BIDS is included with SQL Server 2008.
In this tutorial we will step
through a number of topics that you need to understand to successfully build a
report. Our high level outline is as follows:
- Reporting Services Components
- Install Reporting Services
- Business Intelligence Development Studio (BIDS)
- Install Sample Database
- Create a Simple Report with the Wizard
- Create a Simple Report with the Report Designer
- Deploy Reports
- Configure Report Manager Security
To step through the tutorial topics,
use the outline to the left, the arrow buttons next to the outline topic
heading, or the arrow buttons at the bottom of each page.
Additional Information
|
Reporting Services Components
(Introduction) |
|
Overview
SQL Server Reporting Services 2008 (SSRS) is a full-featured application that provides report design, development, testing, and deployment. In this section we will introduce the main components of the product:
SQL Server Reporting Services 2008 (SSRS) is a full-featured application that provides report design, development, testing, and deployment. In this section we will introduce the main components of the product:
- Databases
- Windows Service
- Report Designer
|
Reporting Services Components -
Databases
|
|
Overview
Reporting Services creates and uses two SQL Server 2008 databases named ReportServer and ReportServerTempDB by default. The ReportServer database has tables to store reports, data sources, snapshots, subscriptions, etc. It is the repository for the reporting application data. The ReportServerTempDB database is used for temporary storage needs, as the default name suggests. When you allow the SQL Server 2008 installer to configure Reporting Services, these two databases are created automatically for you. If you want to create them manually, then you need to use the Reporting Services Configuration Manager. In this tutorial we assume that the SQL Server installer is used to configure Reporting Services.
Reporting Services creates and uses two SQL Server 2008 databases named ReportServer and ReportServerTempDB by default. The ReportServer database has tables to store reports, data sources, snapshots, subscriptions, etc. It is the repository for the reporting application data. The ReportServerTempDB database is used for temporary storage needs, as the default name suggests. When you allow the SQL Server 2008 installer to configure Reporting Services, these two databases are created automatically for you. If you want to create them manually, then you need to use the Reporting Services Configuration Manager. In this tutorial we assume that the SQL Server installer is used to configure Reporting Services.
|
Reporting Services Components -
Windows Service
|
|
Overview
The core of Reporting Services functionality is implemented as a Windows service. While an in-depth understanding of this implementation is not required to use Reporting Services, it is nonetheless interesting at least in terms of a high-level description.
The core of Reporting Services functionality is implemented as a Windows service. While an in-depth understanding of this implementation is not required to use Reporting Services, it is nonetheless interesting at least in terms of a high-level description.
Explanation
The Reporting Services Windows service provides the following functionality as shown below in this diagram taken from Books on Line:
The Reporting Services Windows service provides the following functionality as shown below in this diagram taken from Books on Line:

The following are the main points
about the Windows service:
- The HTTP listener is a new feature; prior versions of Reporting Services required Internet Information Server (IIS). With Reporting Services 2008 IIS is no longer required.
- Report Manager is an ASP.NET application that provides a browser-based interface for managing Reporting Services. We will cover the Report Manager in a later section.
- The Web Service is also implemented as an ASP.NET application; it provides a programmatic interface to Reporting Services. The Report Manager uses the web service. You can use the web service to create your own custom implementation of any feature provided by the Report Manager.
- Background Processing provides the core services for Reporting Services.
- The Report Manager, Web Service, and Background Processing are each implemented as separate application domains.
The above implementation represents
a substantial redesign from the 2005 version of Reporting Services and provides
an enterprise-level reporting engine.
|
Reporting Services Components -
Report Designer
|
|
Overview
The Report Designer provides the capability to design, develop, test and deploy reports. It is a developer-centric tool called Business Intelligence Development Studio (BIDS) that comes with SQL Server 2008. The 2008 version of BIDS has an updated and more intuitive user interface, and many new charts and graphs for enhanced visualizations. We will cover BIDS in later sections of the tutorial.
The Report Designer provides the capability to design, develop, test and deploy reports. It is a developer-centric tool called Business Intelligence Development Studio (BIDS) that comes with SQL Server 2008. The 2008 version of BIDS has an updated and more intuitive user interface, and many new charts and graphs for enhanced visualizations. We will cover BIDS in later sections of the tutorial.
For non-developers SQL Server 2008
has a new and enhanced version of Report Builder, which was first released with
SQL Server 2005. We will not be covering Report Builder in this
tutorial. You can get an introduction to the tool by reading one of our tips
noted below.
Additional Information
|
Install Reporting Services
|
|
Overview
SQL Server Reporting Services 2008 (SSRS) is a feature included in the SQL Server 2008 product. To install SSRS you run the SQL Server 2008 SETUP.EXE program which guides you through the various installation and configuration options for the product. In this section we will discuss the installation and configuration options that pertain to installing SSRS.
SQL Server Reporting Services 2008 (SSRS) is a feature included in the SQL Server 2008 product. To install SSRS you run the SQL Server 2008 SETUP.EXE program which guides you through the various installation and configuration options for the product. In this section we will discuss the installation and configuration options that pertain to installing SSRS.
Explanation
As you proceed through the SQL Server 2008 installation process, you will reach the Feature Selection dialog. Click the checkbox for Reporting Services to perform the installation of SSRS as shown below under Instance Features:
As you proceed through the SQL Server 2008 installation process, you will reach the Feature Selection dialog. Click the checkbox for Reporting Services to perform the installation of SSRS as shown below under Instance Features:

Note that you should also probably
check everything under Shared Features, especially Business Intelligence
Development Studio as we use this tool to design, develop, test, and deploy
reports.
Later in the SQL Server 2008
installation process you will reach the Reporting Services Configuration dialog
as shown below:

Select the first option - Install
the native mode default configuration. This will install SSRS and
configure it for you automatically. SharePoint integrated mode disables
the Report Manager and allows you to store reports in SharePoint document
libraries; to run a report you simply click on it. The last option is
useful where you want to configure the report server manually using the
Reporting Services Configuration Manager.
You can begin using SSRS as soon as
the SQL Server 2008 installation is complete, assuming you chose Install the
native mode default configuration.
Additional Information
- SQL Server Installation Process - Part 1
- SQL Server Installation Process - Part 2
- SQL Server Installation Process - Part 3
- Steps to Install SQL Server 2008 Service Pack 1 (SP1)
- SQL Server Reporting Services Configuration Tool
- Adding Reporting Services to an Existing SQL Server Installation
·
Tutorial Menu
Overview
BIDS is the tool that we use to develop reports. It provides an intuitive interface based on Microsoft's Visual Studio product which has been used by developers for many years. The SQL Server 2008 version of BIDS has some nice enhancements to the user interface for designing, developing and testing reports. You will see these enhancements as we go through this tutorial.
BIDS is included with SQL
Server. When you are running the SQL Server installer, you need to
click the Business Intelligence Development Studio checkbox in the Shared
Features section in order to install BIDS. You probably want to select
all of the items in the Shared Features section. After completing the
installation, you can launch BIDS from the Microsoft SQL Server 2008 program
group.
|
·
Tutorial
Menu
The BIDS paradigm for developing reports is based on the concept of projects and solutions. A project is a container for one type of object such as SSRS reports, web pages, SQL Server Integration Services packages, etc. Projects can be used to organize things in a meaningful way. For instance I could have a project for all reports used by the Accounting department, another project for Human Resource department reports, and another project for the Finance department reports. A solution is a container for one or more projects. Think of a solution as the complete application that can be made up of a number of different types of projects such as a report project, SQL Server Integration Services project, a web project, etc. In this section we will walk through creating an empty solution and adding a report project to that solution. In the sections that follow we will add reports to our report project. Explanation To begin launch BIDS by selecting SQL Server Business Intelligence Development Studio from the Microsoft SQL Server 2008 program group. Click File, New Project on the top-level menu to display the New Project dialog. Click Visual Studio Solutions under Project Types, Blank Solution under Visual Studio installed templates, and enter the Name and Location as shown below:  Click File, Add, New Project from the top-level menu to add a Report Server project to the solution. Fill in the Add New Project dialog as shown below:  We are now ready to move on to our next section where we will install the sample database that we will use to build our reports. |
|||
|
Install Sample Database
|
|
||
Overview
We will use the AdventureWorksLT sample database as the data source for the reports we build in this tutorial. The AdventureWorksLT database was chosen because it is small and the current SQL Server 2008 sample database requires that Full-Text Search be installed, the SQL Full-Text Filter Daemon launcher service is running, and FILESTREAM is enabled. These requirements just add extra work to get us going so we're going to use the slightly older sample database.
We will use the AdventureWorksLT sample database as the data source for the reports we build in this tutorial. The AdventureWorksLT database was chosen because it is small and the current SQL Server 2008 sample database requires that Full-Text Search be installed, the SQL Full-Text Filter Daemon launcher service is running, and FILESTREAM is enabled. These requirements just add extra work to get us going so we're going to use the slightly older sample database.
Explanation
The AdventureWorksLT database is available for download from the following link on the Code Plex site: Microsoft SQL Server Product Samples: Database - Release:SQL Server 2005 SP2a. Click on the appropriate AdventureWorksLT link to download the installer program for your SQL Server environment: AdventureWorksLT.msi, AdventureWorksLT_x64.msi, or AdventureWorksLT_IA64.msi.
The AdventureWorksLT database is available for download from the following link on the Code Plex site: Microsoft SQL Server Product Samples: Database - Release:SQL Server 2005 SP2a. Click on the appropriate AdventureWorksLT link to download the installer program for your SQL Server environment: AdventureWorksLT.msi, AdventureWorksLT_x64.msi, or AdventureWorksLT_IA64.msi.
After downloading the appropriate
version of the installer program, run it by double-clicking the .msi
file. You will be prompted for the folder location to put the database
and log files. For a default installation of SQL Server 2008 the folder
to choose is:
C:\Program Files\Microsoft SQL
Server\MSSQL10.MSSQLSERVER\MSSQL\DATA
Adjust the folder as necessary if
you did not accept the default location during installation of SQL Server 2008.
When the installer program
completes, you have to attach the database to your SQL Server database
engine. Open SQL Server Management Studio, navigate to the Object
Explorer, right click on Databases then select Attach from the menu as shown
below:

The Attach Databases dialog will be
displayed. Click the Add button, navigate to the
AdventureWorksLT_Data.mdf file in the location you specified when you ran the
installer program as shown below:

Click the OK button to attach the database.
|
Create a Simple Report with the
Wizard
|
|
Overview
In an earlier section we covered Business Intelligence Development Studio (BIDS), the tool that developers use to create reports. BIDS provides a Report Designer which allows you to define every aspect of your report. In addition BIDS provides a Report Wizard which will guide you through the steps to build a simple report. With the Report Designer you start out with an empty canvas; you define every aspect of the report yourself. When you are getting started with Reporting Services, the Report Wizard should be your first choice. Once you've built a report with the wizard, you can continue customizing it with the Report Designer. When you reach the point where you are comfortable defining every aspect of your reports and you want to build sophisticated reports and dashboards, then you should use the Report Designer.
In an earlier section we covered Business Intelligence Development Studio (BIDS), the tool that developers use to create reports. BIDS provides a Report Designer which allows you to define every aspect of your report. In addition BIDS provides a Report Wizard which will guide you through the steps to build a simple report. With the Report Designer you start out with an empty canvas; you define every aspect of the report yourself. When you are getting started with Reporting Services, the Report Wizard should be your first choice. Once you've built a report with the wizard, you can continue customizing it with the Report Designer. When you reach the point where you are comfortable defining every aspect of your reports and you want to build sophisticated reports and dashboards, then you should use the Report Designer.
In this section we will use the
Report Wizard to build a simple report. We will walk through the
following steps:
- Launch the report wizard
- Create a shared data source
- Design a query
- Select a report type
- Design a table
- Choose the table layout
- Complete the wizard
|
Launch the Report Wizard
|
|
·
Overview
The Report Wizard guides you through the steps to build a simple report. In this section we will launch the report wizard and get going with creating our first report.
The Report Wizard guides you through the steps to build a simple report. In this section we will launch the report wizard and get going with creating our first report.
·
Explanation
In the earlier section on Projects and Solutions, we created a blank solution and added a Report Server project to the solution. If necessary open the solution by clicking File, Open, Project/Solution from the top-level menu and navigating to the solution file; e.g. MSSQLTips_SSRS_2008_Tutorial.sln. The BIDS Solution Explorer shows our Report Server project along with Shared Data Sources and Reports nodes as shown below:
In the earlier section on Projects and Solutions, we created a blank solution and added a Report Server project to the solution. If necessary open the solution by clicking File, Open, Project/Solution from the top-level menu and navigating to the solution file; e.g. MSSQLTips_SSRS_2008_Tutorial.sln. The BIDS Solution Explorer shows our Report Server project along with Shared Data Sources and Reports nodes as shown below:
·

·
Right click on the Reports node and
select Add New Report to launch the Report Wizard as shown below:
·

·
Note the checkbox "Don't show
this page again". You way want to click it as there isn't much need
to see this dialog every time you want to design a new report using the
wizard. Click the Next button to create a data source for your report
which we will cover in the next section.
|
Create a Shared Data Source
|
|
Overview
The Data Source contains the information necessary to retrieve the data we want to render on our report. Reporting Services can access data in relational databases, OLAP databases, and just about other any data source for which you have an ODBC or OLE DB driver.
The Data Source contains the information necessary to retrieve the data we want to render on our report. Reporting Services can access data in relational databases, OLAP databases, and just about other any data source for which you have an ODBC or OLE DB driver.
When we create a Data Source we can
specify it as shared which means it can be used by any report in the same
project. As a general rule you probably want to create Shared Data
Sources. If a Data Source isn't shared it just means that its definition
is stored inside the report and it cannot be shared with another report.
In this section we will walk through
the details of creating a Shared Data Source.
Explanation
After launching the Report Wizard you will be presented with the Select the Data Source dialog as shown below:
After launching the Report Wizard you will be presented with the Select the Data Source dialog as shown below:

Our project does not have any Shared
Data Sources yet so we do not have the option of selecting an existing Shared
Data Source for our new report. Instead we will have to define a Data
Source. We will have to supply the following:
- Name - choose a descriptive name for this Data Source; we'll use AdventureWorksLT. Do not put any spaces in the name; if you do you will get an error message when you complete the wizard and your Data Source will not be created
- Type - select from the available options in the dropdown list; the default value of Microsoft SQL Server is the correct one for the AdventureWorksLT database that we are using
- Connection String - enter the connection string for your Data Source; usually you will want to click the Edit button to enter the details and have the connection string created for you
- Edit button - rather than entering the connection string, click this button to display the Connection Properties dialog where you can enter some information and have the connection string created for you
- Credentials button - click this button to display the specify Data Source Credentials dialog where you can specify the credentials to use when connecting to your Data Source
- Make this a shared data source checkbox - click this checkbox to create a Shared Data Source; any report in the same project can the use this Data Source
Click the Edit button to display the
Connection Properties dialog; fill in your Server name and select the
AdventureWorksLT database as shown below:

The Server name is the one where
your SQL Server database is deployed. If you are running a named instance
of SQL Server, you will need to specify the Server name as
SERVERNAME\INSTANCENAME. If you are running SQL Server locally you can
specify localhost in place of SERVERNAME. You should click the Test
Connection button to verify that you are able to connect to the database then
click OK to close the dialog.
Click the Credentials button to display
the Data Source Credentials dialog as shown below:

The default selection Use Windows
Authentication (Integrated Security) is okay for our purposes. This means
that Reporting Services will connect to the Data Source using the Windows
credentials of the person running the report. Note that when your report
is complete and you deploy the report and Data Source for others to use, you
can select a different option if necessary. For now we'll stick with the
default.
After completing the above steps,
the Select the Data Source dialog will look as shown below:

Click Next to move on to the Design
the Query dialog which we will discuss in the next section.
|
Design the Query
|
|
Overview
The Design Query step of the Report Wizard allows us to specify what data we want to retrieve from our Data Source and render in our report. In this section we will walk through the details of defining a query to retrieve the data to render on our report.
The Design Query step of the Report Wizard allows us to specify what data we want to retrieve from our Data Source and render in our report. In this section we will walk through the details of defining a query to retrieve the data to render on our report.
Explanation
The Design the Query step in the Report Wizard will display the dialog as shown below:
The Design the Query step in the Report Wizard will display the dialog as shown below:

You can click the Query Builder
button to graphically build your query or you can type your query directly into
the Query string textbox. The following is an example of a query that you
could type in:
|
SELECT
c.ParentProductCategoryName
, c.ProductCategoryName
, SUM(d.LineTotal) Sales
FROM SalesLT.Product p
JOIN SalesLT.vGetAllCategories c
ON
c.ProductCategoryID = p.ProductCategoryID
JOIN SalesLT.SalesOrderDetail d
ON d.ProductID =
p.ProductID
GROUP BY
c.ParentProductCategoryName
, c.ProductCategoryName
ORDER BY
c.ParentProductCategoryName
, c.ProductCategoryName
|
The above query will provide us with
a sales summary broken down by product category. Copy and paste the query
into the Query string textbox in the Design the Query dialog.
Alternatively you could click the Query Builder button and graphically design
the same or a similar query. The Query Builder dialog displays the Query
designer that you are accustomed to seeing in products like Microsoft Access.
Click Next to move on to the Select
the Report Type dialog which we will discuss in the next section.
|
Select the Report Type
|
|
Overview
The Select Report Type step of the Report Wizard allows us to choose from a Tabular or Matrix type of report. In this section we will discuss the details of these available report types.
The Select Report Type step of the Report Wizard allows us to choose from a Tabular or Matrix type of report. In this section we will discuss the details of these available report types.
Explanation
The Select Report Type step in the Report Wizard will display the dialog as shown below:
The Select Report Type step in the Report Wizard will display the dialog as shown below:

The tabular report type is the
traditional report with page headings, column headings, subtotals and totals
running down the page. The matrix report type is one where we define the
fields that go on the columns and rows. In addition the matrix report
type provides interactive drilldown capabilities. We'll create a tabular
report as this will provide a simple and familiar example.
Click Next to move on to the Design
the Table dialog which we will discuss in the next section.
|
Design the Table
|
|
Overview
The Design Table step of the Report Wizard allows us to layout the available fields on our report choosing between Page, Group, and Details.
The Design Table step of the Report Wizard allows us to layout the available fields on our report choosing between Page, Group, and Details.
Explanation
The Design Table step in the Report Wizard will display the dialog as shown below:
The Design Table step in the Report Wizard will display the dialog as shown below:

The Available fields list is
populated based on the query that you defined in the previous step in the
Report Wizard. Click on a field then click on the appropriate button
where you want to put that field. Fill in the dialog as shown below:

The following is a description of
the buttons in the above dialog:
- Page - put a field in this list when you want to begin a new page when the value of the field changes; e.g. to start each ParentProductCategory on a different page
- Group - group by the fields in this list
- Details - the fields in this list appear in each row of the report
Click the Next button to move on to
the Choose the Table Layout dialog which we will discuss in the next
section.
|
Choose the Table Layout
|
|
Overview
The Choose Table Layout step of the Report Wizard allows us to choose a stepped or blocked layout and whether to include subtotals and enable drilldown.
The Choose Table Layout step of the Report Wizard allows us to choose a stepped or blocked layout and whether to include subtotals and enable drilldown.
Explanation
The Choose Table Layout step in the Report Wizard will display the dialog as shown below:
The Choose Table Layout step in the Report Wizard will display the dialog as shown below:

The default of Stepped displays the
groupings as shown above. Block moves things in a little closer which
saves space, but it disables drilldown. Include Subtotals will provide
intermediate totals based on groupings. Enable drilldown will initially
hide details and allow expanding with a click on the plus icon.
Fill in the dialog as shown below:

Click the Next button to move on to
the Chose the Table Style dialog which we will discuss in the next
section.
|
Choose the Table Style
|
|
Overview
The Choose Table Style step of the Report Wizard allows us to choose from a number of different styles. This is a purely cosmetic choice; each selection provides a different color scheme.
The Choose Table Style step of the Report Wizard allows us to choose from a number of different styles. This is a purely cosmetic choice; each selection provides a different color scheme.
Explanation
The Choose Table Style step in the Report Wizard will display the dialog as shown below:
The Choose Table Style step in the Report Wizard will display the dialog as shown below:

Choose a style from the list of
available options the click the Next button to move on to the Completing the
Wizard dialog which we will discuss in the next section.
|
Complete the Wizard
|
|
Overview
The Completing the Wizard step of the Report Wizard displays a summary of our choices from the previous dialogs.
The Completing the Wizard step of the Report Wizard displays a summary of our choices from the previous dialogs.
Explanation
The Completing the Wizard step in the Report Wizard will display the dialog as shown below:
The Completing the Wizard step in the Report Wizard will display the dialog as shown below:

You should provide a descriptive
name for your report in the Report Name textbox; e.g.
ReportWizardExample. You can click the Preview report check box if you
would like to see what your report will look like. Scroll through the
Report summary to review your choices. If there is something you want to
change, click the Back button to revisit the completed dialogs.
Click the Finish button to have the
wizard generate your report. You will now see your report in the Solution
Explorer as shown below:

The report will also be displayed in
the Report Designer. Click on the Preview tab to render your
report. A portion of the report is shown below:

We're going to make a couple of
changes to the report. Click on the Design tab; you will see the
following:

We're going to put spaces between
the words in the heading, make the columns a little wider, and change the
format of the sales numbers. Here are the steps:
- Click in the report heading between the t and W; add a space; do the same for d and E
- Click in the ParentProductCategory cell, an Excel-like grid will appear, click between the cells at the top of the grid and drag to widen them; you will see the cursor change to <--> when you hover between the cells
- Click inside the [Sum(Sales)] column, locate Format in the Properties window and type C0; this will format the cell as currency with no decimals. If you don't see the Properties window, click the top-level View menu then select Properties Window of click F4. Repeat for the [Sales] column.
After making these changes the
report design should look like this:

Click on the Preview tab to display
the report:

You can click on the + icon to the
left of the Parent Product Category Names to drilldown to Product Category Name
details as shown below:

This completes our tutorial section
on the Report Wizard.
|
Create a Report using the Report
Designer
|
|
Overview
In the prior section we created a report using the Report Wizard in Business Intelligence Development Studio (BIDS). In this section we will create a report from scratch using the Report Designer in BIDS. With the Report Designer you start out with an empty canvas; you define every aspect of the report yourself. The Report Designer allows you to create sophisticated reports and dashboards.
In the prior section we created a report using the Report Wizard in Business Intelligence Development Studio (BIDS). In this section we will create a report from scratch using the Report Designer in BIDS. With the Report Designer you start out with an empty canvas; you define every aspect of the report yourself. The Report Designer allows you to create sophisticated reports and dashboards.
In this section we will complete the
following steps in the Report Designer to build a simple report:
- Add a new report to our project
- Create a shared data source
- Create a Dataset
- Configure a Table
The following screen shot shows the
report that we will build as rendered in the Report Manager:

The above report is based on the
same query that we used in the earlier Report Wizard section. The plus
sign icon to the left of the value in the Parent Product Category column allows
us to drilldown to the Product Category details.
Now let's continue on to the next
section and begin to create our report.
|
Create Report
|
|
Overview
The first step in creating a report is to add a new report to our project.
The first step in creating a report is to add a new report to our project.
Explanation
In the earlier section on Projects and Solutions, we created a blank solution and added a Report Server project to the solution. In the previous section we added a new report by stepping through the Report Wizard. The BIDS Solution Explorer shows our Reports project along with the Shared Data Source and ReportWizardExample that we created in the previous section:
In the earlier section on Projects and Solutions, we created a blank solution and added a Report Server project to the solution. In the previous section we added a new report by stepping through the Report Wizard. The BIDS Solution Explorer shows our Reports project along with the Shared Data Source and ReportWizardExample that we created in the previous section:

Right click on the Reports node then
select Add, New Item which will display the Add New Item - Reports dialog; fill
in the dialog as shown below:

Click the Add button to add a new
report to your project. Your new report will be displayed in the Report Designer.
Let's spend a minute to review the Report Designer before we continue with our
task of creating a new report from scratch.
There are three parts of the Report
Designer which you will be using:
- Design Surface - palette where you layout your report
- Report Data - allows you to define Data Sources, Datasets, Parameters and Images; allows you to access a group of built-in fields like Report Name, Page Number, etc. You will drag and drop items from this area onto the design surface.
- Toolbox - contains the Report Items that you drag and drop onto the design surface; e.g. Table, Matrix, Rectangle, List, etc.
Whenever you add a report to your
project or open a report the design surface will be displayed. After
adding a report you will see the following blank design surface:

You can display the Report Data and
Toolbox areas by selecting them from the top-level View menu if they aren't
shown. The Report Data and Toolbox are used a lot so I like to position
them to the left of the designer. The Report Data area is shown below:

In the screen shot above Report Data
and the Toolbox share the same area of the screen; click on the tab at the
bottom to switch between them. The Toolbox contains the following elements that
you will drag and drop onto the design surface:

Note in the heading of Report Data
and the Toolbox there is a push pin icon. Clicking this toggles between
showing the tab and hiding it by putting a button that you can hover over to
display the tab.
You can customize what you see in
the report designer as well as position it however you like. Click on the
Report Data or Toolbox heading and you can drag it around and position
it.
At this point let's continue on to
the next section and create a Shared Data Source.
|
Create a Shared Data Source
|
|
Overview
We discussed the Shared Data Source in the earlier section on using the Report Wizard to create a new report. The Data Source contains the information that Reporting Services needs to retrieve the data that we want to render on our report. A Shared Data Source is one that can be used by any report in the same project. In this section we will create a Shared Data Source.
We discussed the Shared Data Source in the earlier section on using the Report Wizard to create a new report. The Data Source contains the information that Reporting Services needs to retrieve the data that we want to render on our report. A Shared Data Source is one that can be used by any report in the same project. In this section we will create a Shared Data Source.
Explanation
To create a Shared Data Source click on the New button in the Report Data area then select Data Source from the menu as shown below:
To create a Shared Data Source click on the New button in the Report Data area then select Data Source from the menu as shown below:

The Data Source Properties dialog will
be displayed as shown below:

The first thing to do is to provide
a name; enter AdventureWorksLT in the Name textbox. Since we already
defined a Shared Data Source in the earlier section on using the Report Wizard
to create a new report, click the Use shared data source reference radio button
and select AdventureWorksLT from the dropdown list. The Data Source
Properties dialog is shown below:

At this point we are done. If
you need to create a new Shared Data Source, you would click the New button and
complete the Shared Data Source Properties dialog. This is essentially
the same thing we did back in the Report Wizard section of the tutorial.
We can now see our Shared Data
Source in the Report Data area as shown below:

We are now ready to continue on to
the next section and create a Data Set.
|
Create a Data Set
|
|
Overview
A Data Set contains a query that Reporting Services uses to retrieve the data for our report. This query could be a SQL statement like we used in the Design the Query step of the Report Wizard section; it could also be a stored procedure that we execute. In this section we will define a new Dataset by using the same query that we used earlier in the Report Wizard section.
A Data Set contains a query that Reporting Services uses to retrieve the data for our report. This query could be a SQL statement like we used in the Design the Query step of the Report Wizard section; it could also be a stored procedure that we execute. In this section we will define a new Dataset by using the same query that we used earlier in the Report Wizard section.
Explanation
To create a Dataset right click on the AdventureWorksLT Shared Data Source that we created in the previous section and select Add Dataset from the menu as shown below:
To create a Dataset right click on the AdventureWorksLT Shared Data Source that we created in the previous section and select Add Dataset from the menu as shown below:

The Dataset Properties dialog will
be displayed as shown below:

The first thing to do is to provide
a name; enter Main in the Name textbox. Since we only have one Shared Data
Source in our project, it will be selected automatically in the Data source
dropdown. To define our query we could click the Query Designer
button and do it graphically or we could type in the query as we did in the
Report Wizard section. Instead click the Import button which will
initially display the familiar Open File dialog; navigate to the report that we
created earlier in the Report Wizard section of the tutorial as shown below:

Click OK to display the Import Query
dialog as shown below:

The above dialog displays the
Datasets and their queries from the report. Our earlier report has only
one Dataset so just click the Import button. If the report had multiple
Datasets, you could choose the Dataset from the list on the left.
The Report Data area now shows our
new Dataset and the list of available fields as shown below:

We are now ready to continue on to
the next section to configure a Table for our report layout.
|
Design Report Layout
|
|
Overview
The Toolbox contains a number of Report Items that you drag and drop onto the design surface when creating a report. The Table provides the traditional report layout where you render data in a fixed number of columns and a variable number of rows. In this section we will use the Table to define the same report layout that we used earlier in the Report Wizard section.
The Toolbox contains a number of Report Items that you drag and drop onto the design surface when creating a report. The Table provides the traditional report layout where you render data in a fixed number of columns and a variable number of rows. In this section we will use the Table to define the same report layout that we used earlier in the Report Wizard section.
Explanation
To add a Table to the design surface, simply click Table in the Toolbox then drag and drop it onto the design surface. The design surface should look like this:
To add a Table to the design surface, simply click Table in the Toolbox then drag and drop it onto the design surface. The design surface should look like this:

Recall from our previous step where
we created a Dataset; the Report Data is shown below:
Drag and drop the
ProductCategoryName and Sales fields (one at a time) onto a column of the Data
row of our Table as shown below:

Click the Preview tab to render the
report; a portion of the rendered report is shown below:

Click on the Design tab and focus on
the Row Groups at the bottom as shown below:

We want our report to show the
ParentProductCategory broken down by the ProductCategory. Click the arrow
on the (Details) line shown above then click Add Group, Parent Group; fill in
the Tablix group dialog as shown below:

The Table now looks like this:

Right click on the gray border above
the empty column and select Delete Columns from the menu. Click on the
Group1 cell and change the text to Parent Product Category. Click and
drag the gray border above the column headings to make them a little
wider. Click the Preview tab to render the report:

At this point we are almost done; we
need to add Parent Product Category totals, drilldown capability to show/hide
the Product Category details, a grand total, and some general cosmetic
cleanup. Click on the Designer tab to continue.
To add the Parent Product Category
totals, hover the mouse over the empty cell in the Sales column on the
ParentProductCategoryName row; a little icon will appear; click the icon and
select Sales from the popup menu. You will see the expression
[Sum(Sales)] as shown below:

To add the drilldown capability,
right click on the gray border on the bottom row in the designer and select Row
Visibility from the popup menu. Fill in the Row Visibility dialog as
shown below:

The above settings will initially
hide the Product Category details and add the plus sign icon next to the Parent
Product Category to toggle the drilldown. The name Group1 was assigned when
we added the Parent Product category group. Click the Preview tab to
render the report:

Click the Design tab then click the
arrow on the Details line inside the Row Groups area; select Add Total, After
from the popup menu. You will now see a row after the detail row; edit
the blank cells on the total lines to specify a description as shown below:

Finally for the cosmetic changes,
drag and drop a text box above the table and provide a heading for the
report. Click in the Sales cells and specify C0 (i.e. Currency with no
decimals) as the Format property in the Properties window (click View the
Properties on the top-level menu if you don't see the Properties window).
Click Preview to see the completed report:

This completes the section on
creating a report from scratch. We are now ready to continue on to the
next section to discuss the options for deploying reports.
|
Deploy Reports
|
|
Overview
In the prior sections we used Business Intelligence Development Studio (BIDS) to create some sample reports. BIDS has a Preview capability which allowed us to render our report in the development environment. When we have completed a report we need to deploy it so that other users can run it.
In the prior sections we used Business Intelligence Development Studio (BIDS) to create some sample reports. BIDS has a Preview capability which allowed us to render our report in the development environment. When we have completed a report we need to deploy it so that other users can run it.
In this section we will show how to
deploy reports using the following methods:
- Business Intelligence Development Studio (BIDS)
- Report Manager
In SQL Server 2005 Reporting
Services you could also use SQL Server Management Studio to deploy
reports. This functionality has been removed in SQL Server 2008.
You can also deploy reports to a
SharePoint document library when you configure Reporting Services in SharePoint
Integration mode. We are not covering SharePoint Integration in this
tutorial.
Now let's continue on to the next
section to see how to deploy reports from BIDS.
|
BIDS
|
|
Overview
Business Intelligence Development Studio (BIDS) provides the capability to deploy reports. This is very convenient since we use BIDS to design, develop, and test our reports. In this section we will walk through report deployment using BIDS.
Business Intelligence Development Studio (BIDS) provides the capability to deploy reports. This is very convenient since we use BIDS to design, develop, and test our reports. In this section we will walk through report deployment using BIDS.
Explanation
In order to deploy our reports and data sources using BIDS, we need to specify some project settings. Right click on the project name in the Solution Explorer then select Properties from the popup menu; you will see the dialog as shown below:
In order to deploy our reports and data sources using BIDS, we need to specify some project settings. Right click on the project name in the Solution Explorer then select Properties from the popup menu; you will see the dialog as shown below:

The following is a description of
the deployment settings:
- OverwriteDataSources - specify True or False; when you deploy using BIDS you probably want to choose False so that if the Data Source already exists on the deployment target it does not get overwritten. The reasoning is that the connection strings in your development environment are probably different than your target deployment server.
- TargetDataSourceFolder - the name of the folder where you want to deploy you Data Sources; the default value is Data Sources.
- TargetReportFolder - the name of the folder where you want to deploy your reports. The default value is the name of your project.
- TargetServerURL - the URL of your deployment report server; use the format http://SERVERNAME/reportserver where SERVERNAME is the name of the server where you installed Reporting Services. "reportserver" is the default name; if you manually configured Reporting Services using the Reporting Services Configuration Manager then specify the name you used for the report server.
After reviewing the deployment
settings and making any necessary changes, you can deploy all data sources and
reports in the project by right clicking the project in the Solution Explorer
and selecting Deploy from the popup menu. You can deploy specific data
sources and/or reports by selecting them in the Solution Explorer (use Ctrl +
Click to select multiple), right clicking on a selected item and choosing
Deploy from the popup menu.
The success or failure of your
deployment will be reported in the Output window; e.g.:
|
Deploying to http://sql2008test/reportserver
Deploying data source '/Data Sources/AdventureWorksLT'.
Warning : Cannot deploy data source AdventureWorksLT to
the server because it already exists and
OverwriteDataSources
is not specified.
Deploying report '/SSRS 2008
Tutorial/ReportDesignerExample'.
Deploy complete -- 0 errors, 1 warnings
== Build: 1 succeeded or up-to-date, 0 failed, 0 skipped
==
== Deploy: 1 succeeded, 0 failed, 0 skipped ==
|
After a successful deployment of our
sample project, you will see the following on the Report Manager home page:

To navigate to the Report Manager
use the URL http://SERVERNAME/reports; if you manually configured Reporting Services using the
Reporting Services Configuration Manager then specify the name you used for the
Report Manager, You can click on the Data Sources or SSRS 2008
Tutorial folders to see the data source or the reports.
Now let's continue on to the next
section to see how to deploy reports using the Report Manager.
|
Report Manager
|
|
Overview
Report Manager is the web-based application included with Reporting Services that handles all aspects of managing reports. In this section we will walk through report deployment using the Report Manager.
Report Manager is the web-based application included with Reporting Services that handles all aspects of managing reports. In this section we will walk through report deployment using the Report Manager.
Explanation
If you can deploy data sources and reports with BIDS, then why bother with using Report Manager? Probably the best answer is that those who develop reports may not have the necessary permissions to deploy those reports to the production server. When a report is ready for deployment, you may need to hand it off to a person who has the permissions to deploy to the production server and that person doesn't want to use BIDS. Most admins are not developers and what they want is the ability to script out deployments or at least use a tool that isn't developer-centric. Report Manager provides the capability to deploy data sources and reports by using a simple browser-based interface.
If you can deploy data sources and reports with BIDS, then why bother with using Report Manager? Probably the best answer is that those who develop reports may not have the necessary permissions to deploy those reports to the production server. When a report is ready for deployment, you may need to hand it off to a person who has the permissions to deploy to the production server and that person doesn't want to use BIDS. Most admins are not developers and what they want is the ability to script out deployments or at least use a tool that isn't developer-centric. Report Manager provides the capability to deploy data sources and reports by using a simple browser-based interface.
To begin navigate to the Report
Manager home by opening your browser and typing in the URL; e.g. http://SERVERNAME/reports, where SERVERNAME is the server where the Report manager is
deployed. If you are working in your development environment and allowed
the SQL Server installer to install and configure Reporting Services then you
can use localhost as your SERVERNAME.
After navigating to the Report
Manager home you will see the following:
The folders shown in the above
screen shot were created in the previous section where we discussed deploying
data sources and reports using BIDS. Recall that the Reporting Services
project has deployment settings which determine the folders for deploying data
sources and reports. To deploy using the Report Manager we would create
folders for our data sources and reports as shown above by clicking the New
Folder button. Navigate to the new folder by clicking on it, then click
the Upload File button to upload either a data source or a report.
When you click the New Folder
button, the following dialog will be displayed:

Fill in the Name textbox; e.g.
Report Manager Deployment Example and click OK. The Report Manager now
displays the new folder:

Click on the Report Manager
Deployment Example hyperlink to navigate to the folder. We are going to
create a new data source and upload a report.
Typically when you deploy your data
sources, the settings will be different than what you have in your development
environment. Click the New Data Source button to create and configure
your data source as follows:

The following are the main points
about creating a data source:
- You have to enter the connection string; there is no helper dialog
- The Connect using option selected is Windows integrated security; this means the report executes using the Windows credentials of the caller; the caller must have at least read permission on the database
- The Credential stored securely in the report server option along with checking Use as Windows credentials when connecting to the data source is a good choice when you don't want to give the users running the report read permission on the database; rather you specify User name as DOMAIN\USERNAME and give just that account read permission on the database
After clicking OK to finish creating
your data source, click the Upload File button to deploy a report. Fill
in the dialog as shown below by navigating to the report that you want to deploy.
I navigated to the folder where our BIDS project was saved and picked the file
ReportDesignerExample.rdl (reports are stored in XML files with a .RDL
extension):

After clicking OK to deploy the
report, you can click on the report in the Report Manager to render it as shown
below:

|
Configure Report Manager Security
|
|
Overview
Reporting Services implements a role-based security model that leverages the underlying Windows security model for authentication and authorization. You can administer Reporting Services security by using the Report Manager. By default only local administrators will have access to the Report Manager; you have to grant access to other users. There are two aspects to security: site settings and item level settings.
Reporting Services implements a role-based security model that leverages the underlying Windows security model for authentication and authorization. You can administer Reporting Services security by using the Report Manager. By default only local administrators will have access to the Report Manager; you have to grant access to other users. There are two aspects to security: site settings and item level settings.
Now let's continue on to the next
section to see how to configure site settings in Report Manager.
|
Site Settings
|
|
Overview
The first step in implementing Reporting Services security is to specify Site Settings. As the name implies Site Settings have to do with securing the Report Manager. We'll cover item level security in the next section where we talk about securing folders, reports, and data sources.
The first step in implementing Reporting Services security is to specify Site Settings. As the name implies Site Settings have to do with securing the Report Manager. We'll cover item level security in the next section where we talk about securing folders, reports, and data sources.
Explanation
To begin open your browser and launch the Report Manager. By default the Report Manager URL is http://SERVERNAME/reports unless you changed it by manually configuring Reporting Services. You will see the Report Manager home page as shown below:
To begin open your browser and launch the Report Manager. By default the Report Manager URL is http://SERVERNAME/reports unless you changed it by manually configuring Reporting Services. You will see the Report Manager home page as shown below:
Note in the upper right hand corner
the Site Settings hyperlink; click it to navigate to the Site Settings page
then click the Security hyperlink; the Site Settings Security page will be
displayed as shown below:

Site settings offers two roles:
System Administrator and System User. The default installation and
configuration of Reporting Services adds the local administrators group to the
System Administrator role. You can add any user or group that you want to
administer the Report Manager to the System Administrator role. Any user
or group that you want to allow access to the Report Manager content, you add
them to the System User role. Click on the New Role Assignment button to
display the New System Role Assignment page as shown below:

Fill in a user name or group using
the format DOMAIN\USERNAME or DOMAIN\GROUPNAME. If your Reporting
Services installation is on a stand-alone server (i.e. not a member of a
domain) then substitute MACHINENAME for DOMAIN. Check the appropriate box
to add the group or user to the System Administrator or System User role.
Sometimes you may want to add the domain group Authenticated Users to the
System User role; you still have to provide item level security settings which
we will cover in the next section.
|
Item Level Settings
|
|
Overview
The second step in implementing Reporting Services security is to specify Item Level Settings. As the name implies Item Level Settings have to do with securing folders, reports, and data sources.
The second step in implementing Reporting Services security is to specify Item Level Settings. As the name implies Item Level Settings have to do with securing folders, reports, and data sources.
Explanation
To begin open your browser and launch the Report Manager. By default the Report Manager URL is http://SERVERNAME/reports unless you changed it by manually configuring Reporting Services. You will see the Report Manager home page as shown below:
To begin open your browser and launch the Report Manager. By default the Report Manager URL is http://SERVERNAME/reports unless you changed it by manually configuring Reporting Services. You will see the Report Manager home page as shown below:
Click the Properties hyperlink to
navigate to the Security page as shown below:

Note that the local administrators
group is already added to the Content Manager role; this is done by
default. Click on the New Role Assignment button to display the New Role
Assignment page as shown below:

There are a number of built-in roles
available for item level security as shown above. The description
provides the details of what each role is able to do. Wherever possible
it's a good idea to assign role(s) to Windows groups rather than individual
users. Specify the group as DOMAIN\GROUP or an individual user as
DOMAIN\USER then check the appropriate role(s). If you want a group or a
user to just be able to run reports, assign them to the Browser role.
When you create new folders in the
Report Manager, they will automatically inherit the item level security
settings of the parent folder. When you navigate to a folder, click on
the Properties tab then click the Security hyperlink, you will see an Edit Item
Security button. If you click Edit Item Security you will be asked
whether to override the security as specified in the parent folder.
Typically setting item level
security at the folder level is good enough. However you can set security
at the individual item level. Navigate to the desired folder as shown
below:

Click the Show Details button to
display the detailed view as shown below:

Click the icon in the Edit column
for an item then click the Security hyperlink on the Properties page; you
will see the Security page as shown below:

Click the Edit Item Security button
to override the security settings if necessary.
First Report in SSRS 2008
In this article, I will explain how to create a simple
report (that could be first report for a newbie) using SSRS 2008. Here I am
assuming that you have successfully installed SQL Server 2008 along with SSRS.
There are two ways to create Reports in SSRS. You can develop the report manually, or you can use the Report Wizard to give yourself a head start. For this first report, I am going to take advantage of the wizard.
STEP 1:
To begin, start a new Business Intelligence project in Visual Studio 2008 by clicking on Start --> All Programs --> SQL Server 2008 --> SQL Server Business Intelligence Development Studio. Then, from the menu, select File --> New --> Project to open New Project wizard. Now select Report Server Project from Visual studio installed templates and specify Name, Location and Solution Name. I am specifying these ReportProjectSSRS, D:\Hari, and ReportProjectSSRS respectively as shown below:

STEP 2:
In Solution Explorer, right click on Reports folder and
select Add New Report.
 This will open Report
Wizard. Click Next on the Welcome screen and this will bring you to the Select the Data Source
screen.
This will open Report
Wizard. Click Next on the Welcome screen and this will bring you to the Select the Data Source
screen.
 This will open Report
Wizard. Click Next on the Welcome screen and this will bring you to the Select the Data Source
screen.
This will open Report
Wizard. Click Next on the Welcome screen and this will bring you to the Select the Data Source
screen.
STEP 3:
Enter the name of Data Source as dsLocal and select
type as Microsoft SQL
Server. Now click on Edit button to set the connecting string
for data source, this will open Connection
Properties window. Enter Server name and database name and
click on Test
Connection buttion to make sure the connection is established.
Click OK button twice to close Test
Results and Conection
Properties windows.

You can check the Make this a shared data source checkbox
to make this data source as shared so that it can be used for other reports as
well. Now click on Next
to proceed.

STEP 4:
This will open Design
the Query wizard. Here you can define your Query string.
Alternatively you can use Query
Builder... to build your query. I will use below query to pull
data from Employee table:
SELECT
[Emp_code],[Emp_Name],[Desg],
[Emp_code],[Emp_Name],[Desg],
[Head],[DOB],[Basic],[Dept_Code]
FROM Employee (NOLOCK)
Click Next to proceed. It will display Select the Report Type wizard. Select Tabular option and click Next to proceed.
STEP 5:
FROM Employee (NOLOCK)
Click Next to proceed. It will display Select the Report Type wizard. Select Tabular option and click Next to proceed.
STEP 5:
Now you can see Design
the Table wizard. Select required fields from Available fields and
clicked on details button to make these fields available in details part of a
report. You can do data grouping as well using Group button. Click Next to proceed.

STEP 6:
Now you can see Choose
the Table Style wizard. Select default style Slate and click Next. Finally you
can see Completing the
Wizard. Enter report name FirstReport and click Finish to complete
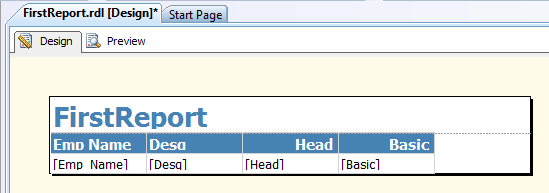
the wizard.

Thats all. We are done with our First report in SSRS 2008.
Report at design time will look like one shown below:
Click on Preview to generate the report:

Article 2:
SQL Server Reporting Services Using Multi-value Parameters
Problem
After working with SQL Server Reporting Services ( SSRS ) for a time, eventually a report user will want to select more than one value for a parameter. How does SSRS handle multi-value parameters?Solution
Allowing users to select multiple values from a parameter list is a great feature in SSRS; it allows report consumers more selection flexibility when running reports. However, how the parameters are passed to the dataset (or report object filters if used) varies depending on if the datasource is based on T-SQL embedded in a dataset within a report or if the data is passed via a stored procedure. Furthermore, once the report is run, a good practice is to display the selected parameter list somewhere within the report. The below instructions will convey the various techniques needed to utilize multi-value parameters. Finally, we will cover using a filter based multi-value parameters.Embedded Parameters
Of the various options, passing multi value parameters to an embedded query is the less complex of the two methods. Utilizing this method, the report designer just needs to write a normal query, and utilize the "IN" key word in the criteria section of the query and then refer to the multi-value parameter using the @parameter name syntax within the parentheses portion of the IN statement. Using an AdventureWorks database and report example, the below code, inserted into a report dataset, notates the required syntax. This syntax should be somewhat standard to many of you who write T-SQL on a daily basis.
SELECT P.FirstName + ' ' +
P.LastName AS Employee
,DATEPART(Year, SOH.OrderDate) AS Year
,DATEPART(Month, SOH.OrderDate) AS MonthNumber
,DATENAME(Month, SOH.OrderDate) AS Month
,SUM(DET.LineTotal) AS Sales
FROM Sales.SalesPerson AS SP
INNER JOIN Sales.SalesOrderHeader AS SOH ON SP.BusinessEntityID = SOH.SalesPersonID
INNER JOIN Sales.SalesOrderDetail AS DET ON SOH.SalesOrderID = DET.SalesOrderID
INNER JOIN Sales.SalesTerritory AS ST ON SP.TerritoryID = ST.TerritoryID
INNER JOIN HumanResources.Employee AS E ON SOH.SalesPersonID = E.BusinessEntityID
INNER JOIN Person.Person AS P ON P.BusinessEntityID = SP.BusinessEntityID
WHERE (YEAR(SOH.OrderDate) IN (@ReportYear))
GROUP BY P.FirstName + ' ' + P.LastName
,SOH.SalesPersonID
,DATEPART(Year, SOH.OrderDate)
,DATEPART(Month, SOH.OrderDate)
,DATENAME(Month, SOH.OrderDate)
Next we will setup the parameter to accept multiple values. In the below
example, a parameter called @ReportYear is already created, so right mouse
clicking on the parameter (Report Year in the below example ) and selecting
Parameter Properties will open the Report Parameter Properties window. Now
check the Allow multiple values option. If you are setting up a new parameter,
right mouse click on Parameters and then select New Parameter. ,DATEPART(Year, SOH.OrderDate) AS Year
,DATEPART(Month, SOH.OrderDate) AS MonthNumber
,DATENAME(Month, SOH.OrderDate) AS Month
,SUM(DET.LineTotal) AS Sales
FROM Sales.SalesPerson AS SP
INNER JOIN Sales.SalesOrderHeader AS SOH ON SP.BusinessEntityID = SOH.SalesPersonID
INNER JOIN Sales.SalesOrderDetail AS DET ON SOH.SalesOrderID = DET.SalesOrderID
INNER JOIN Sales.SalesTerritory AS ST ON SP.TerritoryID = ST.TerritoryID
INNER JOIN HumanResources.Employee AS E ON SOH.SalesPersonID = E.BusinessEntityID
INNER JOIN Person.Person AS P ON P.BusinessEntityID = SP.BusinessEntityID
WHERE (YEAR(SOH.OrderDate) IN (@ReportYear))
GROUP BY P.FirstName + ' ' + P.LastName
,SOH.SalesPersonID
,DATEPART(Year, SOH.OrderDate)
,DATEPART(Month, SOH.OrderDate)
,DATENAME(Month, SOH.OrderDate)


SELECT
Year(SOH.OrderDate) AS Year
FROM
Sales.SalesOrderHeader AS SOH
GROUP BY
Year(SOH.OrderDate)
ORDER BY SOH.Year
Year(SOH.OrderDate) AS Year
FROM
Sales.SalesOrderHeader AS SOH
GROUP BY
Year(SOH.OrderDate)
ORDER BY SOH.Year


=JOIN(Parameters!ReportYear.Value, " & ")
The report with the JOIN function utilized is displayed below.
Multiple Value Parameters and Stored Procedure Based Datasets
Using stored procedures as the basis for SSRS datasets offers many advantages including potential reuse by other reports and potential performance advantages. However, multi-value parameters do not work well when getting passed to a stored procedure. Embedded SQL datasets noted above handle the parsing of the multiple values used in the IN criteria. To the contrary, when the multiple values are passed to a stored procedure, all the values are conveyed as one value.The ReportYear parameter in our example report, for instance, would get passed as one value, "2006,2007,2008" which, of course would return no rows. Fortunately, we can use a string splitter function as part of our stored procedure to break up the years into multiple values. We will once again turn to using a Tally table by Jeff Moden; please see this article on using the Tally table to parse out the values, http://www.sqlservercentral.com/articles/Tally+Table/72993/.
I am not going to repeat Mr. Moden's code in the article, since it would be beneficial for you to understand what it can and cannot do. We will however use this function in dataset stored procedure which is noted below. Please make the following notes about the stored procedure. First we are passing in the concatenated multi-value parameter as a single entity and we use a varchar parameter (which must be large enough to accept the maximum length of all the parameters which might be selected). Next using the splitter function, the values are parsed out and placed into a temporary table, #YEAR_LIST. Last, the year criteria is moved from being part of the where clause to being part of the joins.
SET ANSI_NULLS ON

GO

SET QUOTED_IDENTIFIER ON

GO

-- =============================================

-- Author: Scott Murray

-- Create date: 01/01/2013

-- Description: Sales by year query with parameter breakout

-- =============================================

ALTER PROCEDURE dbo.usp_Sales_by_Year

 @ReportYear varchar(50)


AS

BEGIN

 -- SET NOCOUNT ON added to prevent extra result sets from

 -- interfering with SELECT statements.

 SET NOCOUNT ON;


--Parse values into table which will be an inner join on main data query.

SELECT Item

INTO #YEAR_LIST

FROM

dbo.DelimitedSplit8K(@ReportYear,',')


--Main Dataset


SELECT P.FirstName + ' ' + P.LastName AS Employee

 ,DATEPART(Year, SOH.OrderDate) AS Year

 ,DATEPART(Month, SOH.OrderDate) AS MonthNumber

 ,DATENAME(Month, SOH.OrderDate) AS Month

 ,SUM(DET.LineTotal) AS Sales

FROM Sales.SalesPerson AS SP

INNER JOIN Sales.SalesOrderHeader AS SOH ON SP.BusinessEntityID = SOH.SalesPersonID

INNER JOIN Sales.SalesOrderDetail AS DET ON SOH.SalesOrderID = DET.SalesOrderID

INNER JOIN Sales.SalesTerritory AS ST ON SP.TerritoryID = ST.TerritoryID

INNER JOIN HumanResources.Employee AS E ON SOH.SalesPersonID = E.BusinessEntityID

INNER JOIN Person.Person AS P ON P.BusinessEntityID = SP.BusinessEntityID

INNER JOIN #YEAR_LIST AS YEARLIST ON YEAR(SOH.OrderDate) = YEARLIST.Item --Use join instead of where clause

--WHERE (YEAR(SOH.OrderDate) IN (@ReportYear))

GROUP BY P.FirstName + ' ' + P.LastName

 ,SOH.SalesPersonID

 ,DATEPART(Year, SOH.OrderDate)

 ,DATEPART(Month, SOH.OrderDate)

 ,DATENAME(Month, SOH.OrderDate)


END

GO
Certainly other methods exists to handle the parsing and include using the function in the where clause (I would avoid this method as I would not want to call this function for every row!). Alternatively, you could use a cross apply to match the years with the dataset. The final report utilizing the stored procedure methods is displayed subsequently.

Using Filters with Multiple Value Parameters
One last alternative involving the use of parameters pertains to dataset or object filters. Using filters at the object level, for example on a tablix, actually allows the same "larger" dataset to be used for multiple purposes while at the same time filtering the individual report parts based on a particular criteria. This setup can be advantageous in using a single dataset for all the report data; however, you also need to be careful about retrieving "very large" datasets while only using very small sets of the data. To setup a filter, first select the object in question, and then right mouse, click and select properties as illustrated below.


Conclusion
Multiple value parameters are a wonderful tool within SSRS; their methods in practice, though, varies depending on their usage within embedded T-SQL, within stored procedures, or as part of an SSRS object filter. Embedded T-SQL is somewhat easier to use, however, the query can not be easily shared; to the contrary, using a stored procedure offers the ability to reuse a query (and other set based and logic structures), but you must parse parameter. Using a multiple value parameter with an object filter is also easy to implement as long as you know how to implement the parameter values in the filter. Last, it is often beneficial to display the parameters selected by the report consumer; the join function in SSRS allows you to display the parameter list easily in the report header or body.
Article 3:
Working With Multi-Select Parameters for SSRS Reports
Problem
Multi-select parameters give your users control over their reports while reducing the number of reports they have to work with. In this example, I will demonstrate how to create a multi-select parameter list and pass the values to a stored procedure that will then populate the report. I will be working with the AdventureWorks2008R2 database to create a report which will list sales quotas and amounts for selected Sales Reps.Solution
The key to this solution is a delimited list of values that can be passed from the report to a stored procedure. I will be using the comma as a delimiter, but any delimiter will work.For this example I will be using two parameters. The first parameter will provide a list of Sales Territories. The second parameter will provide a list of Sales Reps based on the selected Sales Territories from the first list. The report will show sales quotas and amounts for the selected Sales Reps.
Step 1
Create a stored procedure that will return a list of Sales Territories. This stored procedure will be used by the first parameter of the report. CREATE PROCEDURE dbo.ListSalesTerritory_s
AS
SET NOCOUNT ON
SELECT
TerritoryID
,[Name] AS TerritoryName
FROM
Sales.SalesTerritory
ORDER BY
[Name]
SET NOCOUNT OFF
GO
Step 2
Create a second stored procedure that will return a list of Sales Reps for 1 to N Sales Territories. This will be used by the second parameter of the report. The list of selected Sales Territories will be passed to the stored procedure as a comma delimited list of TerritoryIDs in a parameter called @TerritoryID. (If your list of values have commas, then you'll have to use a different delimiter.) The size of the parameter should be determined by the maximum list of values that might be sent to the stored procedure.There are many different ways to break up a delimited list of values. They are usually referred to as Split Functions. I like to use a recursive CTE (Common Table Express) to split the values up. After the list of values are in a table structure, the table structure can be joined to the rest of the tables needed to return the list of Sales Reps.
CREATE PROCEDURE ListSalesRep_s (@TerritoryIDs AS varchar(100))
AS
SET NOCOUNT ON;
WITH CTE_Pieces
AS
(
SELECT
1 AS ID
,1 AS StartString
,CHARINDEX(',', @TerritoryIDs) AS StopString
UNION ALL
SELECT
ID + 1
,StopString + 1
,CHARINDEX(',', @TerritoryIDs, StopString + 1)
FROM
CTE_Pieces
WHERE
StopString > 0
)
,CTE_Split
AS
(
SELECT
CONVERT(int,SUBSTRING(@TerritoryIDs, StartString,
CASE
WHEN StopString > 0 THEN StopString - StartString
ELSE LEN(@TerritoryIDs)
END)) AS TerritoryID
FROM
CTE_Pieces
)
SELECT
P.BusinessEntityID
,P.LastName + ', ' + P.FirstName AS SalesRep
FROM
CTE_Split AS S
JOIN Sales.SalesPerson AS SP ON sp.TerritoryID = s.TerritoryID
JOIN Person.Person AS P ON SP.BusinessEntityID = P.BusinessEntityID
SET NOCOUNT OFF
Step 3
Create the stored procedure for the body of the report. In this example, it will also have a parameter, @BusinessEntityIDs that will contain a comma delimited list of selected Sales Reps.
CREATE PROCEDURE dbo.RptSales_s(@BusinessEntityIDs AS varchar(100))
AS
SET NOCOUNT ON;
WITH CTE_Pieces
AS
(
SELECT
1 AS ID
,1 AS StartString
,CHARINDEX(',', @BusinessEntityIDs) AS StopString
UNION ALL
SELECT
ID + 1
,StopString + 1
,CHARINDEX(',', @BusinessEntityIDs, StopString + 1)
FROM
CTE_Pieces
WHERE
StopString > 0
)
,CTE_Split
AS
(
SELECT
CONVERT(int,SUBSTRING(@BusinessEntityIDs, StartString,
CASE
WHEN StopString > 0 THEN StopString - StartString
ELSE LEN(@BusinessEntityIDs)
END
)
) AS BusinessEntityID
FROM
CTE_Pieces
)
SELECT
P.LastName + ', ' + P.FirstName AS SalesRep
,ST.Name AS TerritoryName
,ST.CountryRegionCode
,SP.SalesQuota
,SP.Bonus
,SP.SalesYTD
,SP.SalesLastYear
FROM
CTE_Split AS s
JOIN Sales.SalesPerson AS SP ON s.BusinessEntityID = sp.BusinessEntityID
JOIN Sales.SalesTerritory AS ST ON SP.TerritoryID = ST.TerritoryID
JOIN Person.Person AS P ON SP.BusinessEntityID = P.BusinessEntityID
SET NOCOUNT OFF
GO
Step 4
Add the three stored procedures that were created in steps 1 through 3 to a new report. Then create the layout for the report. My report is laid out by grouping the Sales Reps by Territory.
Finished Report
Step 5
Set the Properties of both parameters by right clicking on the parameter and selecting Parameter Properties from the drop down list.- Check the Allow multiple values checkbox.
- Select Available Values from the left hand list.
- Select the Get values from a query option button.
- Set the Dataset drop down list to the proper dataset.
- Set the Value field drop down list to the proper field. This is the value that will be returned to the dataset that needs it.
- Set the Label field drop down list to the proper field. This is the value that will be displayed to the user.


Step 6
The list of selected values need to be returned to the ListSalesRep_s and the RptSales_s stored procedures. This will be done using the JOIN expression.- Right click on the stored procedure that needs the list of values and select Dataset Properties from the drop down list.
- Select Parameters in the left hand list of the Dataset Properties dialog box.
- In this example, the delimited list of Territories need to be assigned to the @TerritoryIDs parameter. Click the function button to enter a function for the parameter value.
- Add the following code for the expression. Make sure to use the Value property, not the Label property or the wrong list of values will be sent to the stored procedure.

=Join(Parameters!TerritoryIDs.Value,",")
Step 7
It's time to run your report. When the drop down lists are pulled down, there should be check boxes to select only the rows you want. Each time the selected items are changed in the Territory IDs drop down, the Sales Rep list will automatically be regenerated when the Sales Rep list is pulled down.

BUT THAT'S NOT ALL...
I think all reports should display the values of the parameters used in the report. This way when someone brings up a concern about a report, you know exactly which parameter values were used.If you'll notice in the sample below, I listed only the three Territories that were selected, but since all the Sales Reps for those territories are used in the report, the word ALL is used instead of listing each Sales Rep out individually. This can be done with an IIF expression in a Label control.

Article 4:

Top SQL Server Tools

Creating Dynamic Report Filters in SQL Server Reporting Services SSRS
|
|
Problem
I have a requirement where I need to provide two report parameters for a report. The first parameter will present a list of columns that the user can choose to filter the report. The second parameter will contain a list of available values based on what was chosen for the first parameter. As an example my first report parameter provides the options Gender and Marital Status. Based on the user selection I need to populate my second report parameter's available list with Male and Female or Married and Single. How can I do this?
I have a requirement where I need to provide two report parameters for a report. The first parameter will present a list of columns that the user can choose to filter the report. The second parameter will contain a list of available values based on what was chosen for the first parameter. As an example my first report parameter provides the options Gender and Marital Status. Based on the user selection I need to populate my second report parameter's available list with Male and Female or Married and Single. How can I do this?
Solution
SSRS provides the capability to define a dataset to be used to populate the dropdown list for a report parameter. When you define the dataset you specify a query or stored procedure that will return the list of values for the report parameter dropdown. In this case we have a slight variation; the list of available values for the second report parameter isn't filtered based on the first parameter; it's completely different for each choice.
SSRS provides the capability to define a dataset to be used to populate the dropdown list for a report parameter. When you define the dataset you specify a query or stored procedure that will return the list of values for the report parameter dropdown. In this case we have a slight variation; the list of available values for the second report parameter isn't filtered based on the first parameter; it's completely different for each choice.
As a starting point let's implement some functions
and stored procedures that we can use to solve this problem; then we'll create
a report that will leverage these objects.
Functions and Stored Procedures
I want to create a function that will return the
list of available values for each different filter parameter. By creating
individual functions I can reuse them in multiple reports. The following
functions will be used to populate the report parameter dropdown lists for
Gender and Marital Status:
create function dbo.GetGenderChoiceList() returns table as return ( select 'Female' as FILTER_LABEL
, 'F' as FILTER_VALUE union all select 'Male' , 'M' ) go create function dbo.GetMaritalStatusChoiceList() returns table as return ( select 'Married' as FILTER_LABEL
, 'M' as FILTER_VALUE union all select 'Single'
, 'S' ) go |
The above functions are examples of table-valued
functions. They can be specified in the FROM clause of a select statement
same as if they were actual tables. There are two column aliases that are
used: FILTER_LABEL and FILTER_VALUE. When you define a report parameter and
specify that the available options come from a query, you specify which column
in the result set is the label (what you see in the dropdown list) and which
column is the value (what you filter on). By aliasing these as
FILTER_LABEL and FILTER_VALUE we make all parameter lists look the same.
Next let's create the stored procedures we
need. We'll be creating a stored procedures to populate the report
parameter dropdown lists and query the customer table.
GetCustomerFilterOptions will be used to populate
the first report parameter dropdown, allowing the user to choose the filter
column. It is shown below:
create procedure dbo.GetCustomerFilterOptions as begin set nocount on; select 'Gender' as FILTER_LABEL
, 'Gender' as FILTER_VALUE
union all select 'Marital Status'
, 'Marital Status'
end go |
The FILTER_LABEL and FILTER_VALUE are the same; we
could have assigned numbers to the FILTER_VALUE but in this case it is more
intuitive to just go with the text descriptions.
GetFilterChoiceList will be used to populate the
second report parameter dropdown, giving us the list of available values based
on the filter column selected in the first report parameter dropdown; it is
shown below:
create procedure dbo.GetFilterChoiceList @filterby varchar(50)
as begin set nocount on; declare @sql nvarchar(500) set @sql = case @filterby when 'Gender' then
N'select FILTER_LABEL, FILTER_VALUE
from dbo.GetGenderChoiceList()'
when 'Marital Status' then
N'select FILTER_LABEL, FILTER_VALUE
from dbo.GetMaritalStatusChoiceList()'
end exec sp_executesql @sql
end go |
Note that GetFilterChoiceList simply calls the
appropriate function that we created earlier, based on the filterby
parameter. The sp_executesql stored procedure is used to execute a
dynamic SQL statement.
FilterCustomerList contains a query to select
customers and apply a filter based on parameters passed in to the stored
procedure; it is shown below:
create procedure dbo.FilterCustomerList @filterby varchar(50)
, @filtervalue varchar(50) as begin set nocount on; select LastName, Gender, MaritalStatus
from dbo.DimCustomer where Gender = case when @filterby = 'Gender' then
@filtervalue else Gender end
and
MaritalStatus = case when @filterby = 'Marital Status' then
@filtervalue else MaritalStatus end
end go |
The WHERE clause in FilterCustomerList utilizes a
case statement that compares a column to the filter value passed in as a
parameter (if that was the filter by option) or to itself (if the filter by
option is on a different column). This simplifies the WHERE clause.
The dbo.DimCustomer table is in the AdventureWorksDW database which you can
download from the Code Plex site.
We can run the following script to test our stored
procedures:
exec dbo.GetCustomerFilterOptions exec dbo.GetFilterChoiceList 'Gender' exec dbo.FilterCustomerList 'Gender', 'M' |
The results returned from the above script are
shown below:

The above results show the list of filter options,
the filter choice list for Gender, and the customers where Gender is Male (M).
Create the Report
The following steps show creating the report using
Business Intelligence Development Studio (BIDS) 2005 where the report design
surface contains the following tabs:

The Data tab is used to create datasets (select New
Dataset from the dropdown list on the Data tab), the Layout tab is used to
specify the report layout, and the preview tab allows you to run the report
within BIDS. The annotations on the above screen shot call out the
buttons on the data tab that you can click to execute the query (or stored
procedure) and refresh the field list; i.e. the columns returned. You
should execute the query (or stored procedure) in order to make sure that the
result set columns are available in the dataset.
At a high level we need to perform the following
steps:
·
Create datasets to populate the report parameter
dropdown lists and create a dataset to return the filtered list of customers
·
Configure the report parameters to populate the
dropdown lists based on the datasets
·
Layout the report
Create Datasets
Create a new dataset that will be used to
populate the first report parameter dropdown list; specify the command type as
StoredProcedure, enter the stored procedure name GetCustomerFilterOptions as
the query string:

Create a new dataset that will be used to populate
the second report parameter dropdown list; specify the command type as
StoredProcedure, enter the stored procedure name GetFilterChoiceList as the
query string:

Create a new dataset that will be used to query the
DimCustomer table based on the report parameters; specify the command type as
StoredProcedure, enter the stored procedure name FilterCustomerList as the
query string:

If you follow a consistent naming convention for
stored procedure parameters, the Parameters tab (shown in the Dataset screen
shots above) will get filled in automatically and will match the report
parameters (discussed in the next section). Occasionally you will have to
manually edit the Parameters tab or the Report Parameters (discussed below) if
you are not consistent with naming.
Configure Report Parameters
In this step we will specify the dataset to use to
populate each report parameter dropdown list. Click Report on the
top-level menu in BIDS, then select Report Parameters (you may have to click on
the Layout tab in order to see the Report top-level menu). You will see
the Report Parameters dialog as shown below:

Select filterby in the Parameters listbox and
specify the Available values as shown below:

Select filtervalue in the Parameters listbox and
specify the Available values as shown below:

Layout the Report
Click on the Layout tab, drag the Table report item
from the Toolbox onto the layout design surface, then fill in the columns as
shown below by dragging them from the CustomerQuery dataset and dropping them
onto the table:

Run the Report
Click the Preview tab, select a value from the
filterby and filtervalue dropdown lists, then click View Report and you will
see the following:

Article 6:
Hiding parameters and using default parameter values in SSRS reports
Problem
Many times in a parameterized report, we may come across situations where we need to execute a report using a fixed parameter value depending upon the users group. In such cases, displaying a list of parameters to the user would not make sense. Also a parameterized report can be used as a model to generate different flavors of the same report, varying on the parameter values. In such a case, hiding the parameter value would be the primary design requirement. In this tip we will take at look at how to implement this solution.Solution
To emulate the problem in question and see the solution in action, we would need a parameterized report. I will go with the assumption that the reader has working knowledge of SSRS and consider it as granted that the reader has already created a parameterized report.For demonstration purposes, I have a simple table as shown in the below screenshot and a report which displays records based on the value of a City parameter as shown in the next screenshot.


Say our requirement is to show records having the City parameter value "Mumbai", and we do not intend to prompt users to select the parameter values. To implement this, navigate to reports manager, select "Manage" from the options available for the report and move to the "Parameters" tab.
Below the parameters and options are displayed and you can adjust the options available for each parameter. As our requirement is to display records for the parameter value "Mumbai", add this in as the default parameter value for the report. Also check the option to hide the parameter as shown in the below screenshot.

Now try executing this report and you will not get the parameter prompt and the report will execute for the parameter value of "Mumbai". Using parameterized reports with proper security configuration and appropriately tuned parameter values can cater to a lot of common reporting requirements that vary partially based on parameter values.

Article 7:
Custom control and setup of SSRS report parameters from a web page
Problem
I have a ASP.NET web application that I would like to present SQL Server Reporting Services reports in. I understand that reports can be rendered using the ReportViewer control, but the interface for parameters is a little bland and doesn't match our site colors. Is there a way that report parameters can be passed to the Report Services instance without having to use the Reporting Services parameter prompts?
I have a ASP.NET web application that I would like to present SQL Server Reporting Services reports in. I understand that reports can be rendered using the ReportViewer control, but the interface for parameters is a little bland and doesn't match our site colors. Is there a way that report parameters can be passed to the Report Services instance without having to use the Reporting Services parameter prompts?
Solution
Luckily, there is a fairly straightforward way of passing report parameters to the Reporting Services instance. Let's say we have a web site that tracks the hourly weather observations of a number of airports in the area. We can offer a report using Reporting Services that will allow the users to select a site, a start date, and an end date for the observations they want to see. Once you open Visual Studio 2005 and the page you want to add the report to, you'll see a ReportViewer control in the Data tab of the toolbox. If you don't see the Report Viewer control, it's because the control has a separate installation package from Visual Studio 2005 that you can download here:
Luckily, there is a fairly straightforward way of passing report parameters to the Reporting Services instance. Let's say we have a web site that tracks the hourly weather observations of a number of airports in the area. We can offer a report using Reporting Services that will allow the users to select a site, a start date, and an end date for the observations they want to see. Once you open Visual Studio 2005 and the page you want to add the report to, you'll see a ReportViewer control in the Data tab of the toolbox. If you don't see the Report Viewer control, it's because the control has a separate installation package from Visual Studio 2005 that you can download here:

Once you have installed the ReportViewer control
(or see it in the Data tab of the toolbox), you can start building the
page. For this example I create a simple page with three text boxes, two image
buttons to control the calendars and a link button that will pass the
parameters and render the report:

In addition to the controls above, I dragged a ReportViewer
control onto the page while in Design mode. The benefit to dragging it
over in Design mode is that the reference to the Microsoft.Reporting.WebForms namespace is automatically
added to the page. Once the control is on the page, the rest of the work is
done using either Visual Basic or C# (this example will use Visual Basic). One
setting you can add to the ReportViewer control in Design or HTML mode is the Processing Mode. The ReportViewer control can render
reports from a local source, called a Client Report Definition File, or RDLC. They can also
render reports from a remote source, like a SQL Server Reporting Services
instance. In this case, we have a Reporting Services instance available to us,
so we will use the remote processing mode:

Now that we have the ReportViewer control in the
page and the general layout taken care of, we can write the code that fires
when the View report link button is clicked. First we declare a generic
list of report parameters. This involves both the System.Collections.Generic
namespace as well as the Microsoft.Reporting.WebForms namespace. On the SQL
Server Reporting Services report there are three parameters: SiteID, StartDate,
and EndDate. You'll also notice in the code below that we use the actual report
server URL (like "http://www.mssqltips.com/reportserver"), not the
Report Manager URL ("http://www.mssqltips.com/reports"). We then add
a report parameter for each one to the generic list of parameters and specify
the report path. The ServerReport.SetParameters function is used to apply the
report parameters specified in the generic list to the actual report parameters
on the Reporting Services report:
|
Code for Passing Report Parameters to the
Reporting Services Instance
|
Protected Sub cmdGetReport_Click(ByVal sender As Object, ByVal e As System.EventArgs) Handles cmdGetReport.Click
Dim colRP As New System.Collections.Generic.List(Of Microsoft.Reporting.WebForms.ReportParameter)
colRP.Add(New Microsoft.Reporting.WebForms.ReportParameter("SiteID", UCase(txtSiteID.Text.Trim)))
If IsDate(txtStartDate.Text.Trim) Then
Dim dteStart As Date = txtStartDate.Text.Trim
colRP.Add(New Microsoft.Reporting.WebForms.ReportParameter("StartDate", Right("0" & dteStart.Month, 2) & "/" & _
Right("0" & dteStart.Day, 2) & "/" & dteStart.Year))
End If
If IsDate(txtEndDate.Text.Trim) Then
Dim dteEnd As Date = txtEndDate.Text.Trim
colRP.Add(New Microsoft.Reporting.WebForms.ReportParameter("EndDate", Right("0" & dteEnd.Month, 2) & "/" & _
Right("0" & dteEnd.Day, 2) & "/" & dteEnd.Year))
End If
rvWeather.ServerReport.ReportServerUrl = New Uri("http://www.cullensolutions.com/ReportServer$SQL2K5")
rvWeather.ServerReport.ReportPath = "/Weather/Site Report"
rvWeather.ServerReport.SetParameters(colRP)
rvWeather.ServerReport.Refresh()
rvWeather.Visible = True
End Sub
When the user reaches the page, all they have to do
is enter the parameters they want and click the View Report button:


Article 8:
Creating a Reporting Service Report Template
Problem
You have several report developers working on a large scale SSRS 2008R2 project and they are generating report after report. You would like all the reports to have the same "look and feel", at least on the header and footer sections, and even include some base queries for items commonly included as parameters for each report. How can you create such a template and make it appear in the New Project List?Solution
Creating a report template is a several step process. First you need to gather your header and footer requirements, next, you will want to prepare a list of common parameters to be included in the template. Once the header and footer requirements and the parameter queries are documented, a basic report can be designed to address the requirements. Last, you will deploy the template to the appropriate report server template folder on the file system.Gathering Requirements
Requirements gathering remains as one of the most important steps in creating a template. The template designer, the report developers, and the end user report consumers all need to brainstorm on what items should and should not be included in the header, footer, and body areas of every report. Some suggestions for the header include: a company or division logo, a facility, location, or company name, a report title, a time period for the report, and any parameter criteria that must be prominently placed at the top of each page. Next, in the process is scoping out the footer area. Some suggested items for this area include: page numbers (individual and in total), report run time and date, report path from the report server, report name, report criteria, and source information. Additionally, in the body of the report, either at the beginning or end of the report content, you may set aside an area for displaying extended report parameters or criteria. Your scope process should also include a default report size and orientation as these items will ultimately impact the placement of the other objects in the header and footer. One potential idea is to actually use Excel to prototype your initial template during the design phase; a sample of such a design is displayed below.
Template Design
Start the actual report template by opening up Business Intelligence Design Studio (BIDS), and then open either an existing Report Server Project or Create a new Report Server Project.


Moving the Template to the Visual Studio Report Project Folder
Once your template is complete, you will need to manually copy the file to the appropriate SSRS ProjectItems directory. Below are the default or common locations where the templates are stored. If you changed the default installation directory for SQL Server, you will need to adjust accordingly.(SSRS 2005) - C:\Program Files\Microsoft Visual Studio 8\Common7\IDE\PrivateAssemblies\ProjectItems\ReportProject
(SSRS 2008) - C:\Program Files\Microsoft Visual Studio 9.0\Common7\IDE\PrivateAssemblies\ProjectItems\ReportProject


Article 9:
SSRS Textbox Tips and Tricks
Problem
As you begin to work with SQL
Server Reporting Services, you find may the need to utilize some more
advanced options for cells and textboxes that get dropped onto Tablixes. What
options are available? Check out this tip to learn more.
Solution
SQL
Server Reporting Services (SSRS) offers several different options for
working with textboxes on a report. Some of these options include the following
three items:
- Adding multiple textboxes to a single cell on a tablix.
- Adding a chart or graph to a tablix.
- Special formatting options and adding line feed / carriage returns.
Let's take a look at examples of each.
Multiple Textboxes in a single cell of a SQL Server Reporting Services Report
It may seem counter intuitive, but SSRS provides
the functionality to add multiple textboxes into a single cell on a Matrix.
Several reasons exists for wanting to embed these multiple textboxes. First, in
the header rows or columns, it can be beneficial to space out the certain text
or even images onto specific parts of an individual cell or it may be helpful
to have two distinct records under a single column header. Displaying a
sparkline or chart immediately next to a numeric value is also another valid
reason (this process will be covered in the next section below). So how can
multiple textboxes be added to a single cell. I will be using the
AdventureWorks database and some related reports to demonstrate these tips.
Step 1 is to drag the Rectangle Object into a cell.

Step 2 is to drag multiple textboxes onto the
Rectangle object. Then resize the individual textboxes as needed. Also,
"text" can be added to the textboxes as in the example below, or if
within the data area, individual fields can be added.


The end result is multiple textboxes each with its
own border, but contained within a single cell.

Charts and Sparklines within a textbox or Cell of an SSRS Report
This next tip may also appear counter intuitive,
but charts and sparklines can be added to one cell within a tablix row, which
produces a succinct chart just for the particular row group. For example, we
may want to see sales broken out by store; however, we may also want to see a trended
monthly sales line chart for each of the respective stores.
This first step in this process is to drag a chart
or sparkline object to the cell.

Next, add the Sparkline Properties for the values
and groups.

The end result is a report which displays not only
current sales, but also a trended graph showing the sales trend. Of course, you
can utilize other charts instead of a line chart. As displayed in the second
figure below, pie charts create an excellent breakout for each category for a
given group, which in turn means you would not have to create a separate chart
for each group. That is quite handy!


Special formatting and Carriage Returns in SQL Server Reporting Services
By the nature of using SSRS, we are wanting to
present our data in a nice, "formatted" structure, otherwise we would
just run a query and work with the results. SSRS does a great job of handling
basic formatting within a cell that has just a single field. However, what
happens if for instance you are concatenating two fields of different data
types into one textbox? Often times this situation occurs when displaying a
report run date which you would like to display as "Report Run Date:
05/13/2013" (not including the time). Which standard format do you use for
that textbox? The answer is to use the SSRS formatting function to format each
piece of the concatenated expression in the cell. To accomplish this process,
first drag the Execution Time Built In Field to the footer.

Next, right click on the textbox and select
Expression. Adjust the expression to read as follows.

The footer with the current expression displays as
follows.

However, if we only want the date to show (and not
the time), we can not just format the textbox with a short date format because
of the "Report Run Date" string. Fortunately, we can use the Format
function to actually apply the date format to just the 2nd part of the
expression. The new expression syntax is displayed below.

The footer now displays only the date. For more
information on SSRS Expressions including the format function, see Expression
Examples on MSDN: http://msdn.microsoft.com/en-us/library/ms157328.aspx
.

Using this same textbox, say that we want to have
the date appear on the line below the "Report Run Date:" expression.
As noted in the below example, we can insert "chr(10) & chr(13)"
into our expression which instructs SSRS to insert a carriage return / line
feed into the textbox upon rendering.

Now the date appears on line 2 in the below figure.
Inserting a line feed is often handy for titles in the header and footer area
of a report.

Article 10:
SSRS Expressions
Reporting Services Expressions
In Reporting Services, Expressions are used frequently in reports to control content and report appearance. Expressions are used throughout the report definition to specify or calculate values for parameters, queries, filters, report item properties, group and sort definitions, text box properties, bookmarks, document maps, dynamic page header and footer content, images, and dynamic data source definitions.
In Reporting Services, Expressions are used frequently in reports to control content and report appearance. Expressions are used throughout the report definition to specify or calculate values for parameters, queries, filters, report item properties, group and sort definitions, text box properties, bookmarks, document maps, dynamic page header and footer content, images, and dynamic data source definitions.
Expressions
begin with an equal (=) and are written in Visual Basic. Expressions can
include a combination of constants, operators, and references to built-in
values (fields, collections, and functions), and to external or custom code.
Expressions can be one of the following two types:
- Simple - An expression that is a single reference to an item in a built-in collection, such as, a dataset field, a parameter, or a built-in field. Simple expressions appear on the design surface and in dialog boxes in brackets, such as [FieldName], which represents the underlying expression =Fields!FieldName.Value. You can type simple expressions directly into a text box on the design surface and the corresponding expression text is set as the value of a placeholder inside the text box.
- Complex - An expression that includes more than a simple reference. Complex expressions appear on the design surface as <>. You can create complex expressions in the Expression dialog box or type them directly into the Property pane.
Examples of SSRS Expression
Using Built-in Fields
Display Report Execution Time in a textbox:
="Report
Execution Time: " & Globals!ExecutionTime
Display Page No in a textbox:
="Page " & Globals!PageNumber & " of " & Globals!TotalPages
="Page " & Globals!PageNumber & " of " & Globals!TotalPages
Similar way you can use other
built-in Fields in expressions e.g. Report Folder, Report Name,
ReportServerUrl, UserID, Language etc. as shown below:

Date
& Time Functions
The Today()
function provides the current date. The expression =Today() can be used in a text box to display the date on the report,
or in a parameter to filter data based on the current date. This function will
return date in M/d/yyyy 12:00:00 AM format. You can use Format function to
display required format. Some of the popular date formats are given below:
|
Expression
|
Output
|
|
=FORMAT(Today(),"M/d/yy")
|
8/23/10
|
|
=FORMAT(Today(),"MM-dd-yyyy")
|
08-23-2010
|
|
=FORMAT(Today(),"MMM-dd-yyyy")
|
Aug-23-2010
|
|
=FORMAT(Today(),"MMMM dd, yyyy")
|
August 23, 2010
|
|
=FORMAT(DateField,"MMM dd, yyyy hh:mm:ss")
|
Aug 23, 2010
01:43:33
|
|
=FORMAT(DateField,"MMM dd, yyyy HH:mm:ss")
|
Aug 23, 2010
13:43:33
|
|
=FORMAT(DateField,"MMM dd, yyyy HH:mm:ss.fff")
|
Aug 23, 2010
13:43:33.587
|
|
=FORMAT(DateField,"MMM dd, yyyy hh:mm:ss tt")
|
Aug 23, 2010
01:43:33 PM
|
Note: FormatDateTime function
can also be used to format the date field e.g. =FormatDateTime(Fields!BirthDate.Value,
DateFormat.ShortDate)
DateAdd - Returns a Date value
containing a date and time value to which a specified time interval has been
added. this function can be used in an expression to add/substract
time(day, month, year, sec etc.) from given date field:
=DateAdd(DateInterval.Month, 6, Parameters!StartDate.Value)
=DateAdd(DateInterval.Month, 6, Parameters!StartDate.Value)
DateDiff - Returns a Long value
specifying the number of time intervals between two Date values.
=DateDiff("yyyy",Fields!BirthDate.Value,Today())
=DateDiff("yyyy",Fields!BirthDate.Value,Today())
DatePart - Returns an Integer value
containing the specified component of a given Date value.
=DatePart("q",Fields!BirthDate.Value,0,0)
=DatePart(DateInterval.Quarter,Fields!BirthDate.Value, FirstDayOfWeek.System, FirstWeekOfYear.System)
=DatePart("q",Fields!BirthDate.Value,0,0)
=DatePart(DateInterval.Quarter,Fields!BirthDate.Value, FirstDayOfWeek.System, FirstWeekOfYear.System)
There are many other Date &Time functions which can be
used expression:

String
Functions
• Combine more than one field by using concatenation
operators and Visual Basic constants. The following expression returns two
fields, each on a separate line in the same text box:
=Fields!FirstName.Value
& vbCrLf & Fields!LastName.Value
•Format dates and numbers in a string with the Format
function.
=Format(Parameters!StartDate.Value,
"M/D") & " through " &
Format(Parameters!EndDate.Value, "M/D")
•The Right,
Len,
and InStr
functions are useful for returning a substring, for example, trimming
DOMAIN\username to just the user name. The following expression returns the
part of the string to the right of a backslash (\) character from a parameter
named User:
=Right(Parameters!User.Value,
Len(Parameters!User.Value) - InStr(Parameters!User.Value, "\"))
The following expression
results in the same value as the previous one, using members of the .NET
Framework System.String class instead of Visual Basic functions:
=User!UserID.Substring(User!UserID.IndexOf("\")+1, User!UserID.Length-User!UserID.IndexOf("\")-1)
=User!UserID.Substring(User!UserID.IndexOf("\")+1, User!UserID.Length-User!UserID.IndexOf("\")-1)
• Join - Display the
selected values from a multivalue parameter
=Join(Parameters!MyParameter.Value,",")
=Join(Parameters!MyParameter.Value,",")
•The Regex functions from
the .NET Framework System.Text.RegularExpressions are useful for changing the
format of existing strings, for example, formatting a telephone number. The
following expression uses the Replace function to change the format of a ten-digit
telephone number in a field from "nnn-nnn-nnnn" to "(nnn)
nnn-nnnn":
=System.Text.RegularExpressions.Regex.Replace(Fields!Phone.Value, "(\d{3})[ -.]*(\d{3})[ -.]*(\d{4})", "($1) $2-$3")
=System.Text.RegularExpressions.Regex.Replace(Fields!Phone.Value, "(\d{3})[ -.]*(\d{3})[ -.]*(\d{4})", "($1) $2-$3")
There are many other function which can be used in expression
as shown below:


Conversion
Functions
You can use Visual Basic functions to convert a field from the one data type to a different data type.
The following expression converts the constant 100 to type
Decimal in order to compare it to a Transact-SQL money data type in the Value
field for a filter expression: =CDec(100)
- The following expression displays the number of values selected for the multivalue parameter MyParameter: =CStr(Parameters!MyParameter.Count)
Decision Functions
The IIF function returns one of two values depending on whether the expression is true or false. The following expression uses the iif function to return a Boolean value of True if the value of Total exceeds 100. Otherwise it returns False:
=IIF(Fields!Total.Value
> 100, True, False)
Use multiple IIF functions (nested IIFs) to return one of three values depending on the value of PercentComplete. The following expression can be placed in the fill color of a text box to change the background color depending on the value in the text box.
=IIF(Fields!PercentComplete.Value
>= 10, "Green",
IIF(Fields!PercentComplete.Value >= 1, "Blue",
"Red"))
A different way to get the same functionality uses the Switch function. The Switch function is useful when you have three or more conditions to test. The Switch function returns the value associated with the first expression in a series that evaluates to true:
=Switch(Fields!PercentComplete.Value
>= 10, "Green",
Fields!PercentComplete.Value > 1, "Blue",
Fields!PercentComplete.Value = 1, "Yellow",
Fields!PercentComplete.Value <= 0, "Red",)
A third way to get the same functionality uses the Choose function. The Choose function uses the first parameter as an index to one of the remaining function parameters. The first parameter must be an integer. If the background color of a text box in a table is set to this expression, the value of MyIndex controls the color.
=Choose(Fields!MyIndex.Value,"Red","Green","Yellow")
Check the value of the PurchaseDate field and return
"Red" if it is more than a week old, and "Blue" otherwise.
This expression can be used to control the Color property of a text box in a
report item:
=IIF(DateDiff("d",Fields!PurchaseDate.Value,
Now())>7,"Red","Blue")
Article 11:
SQL Server Reporting Services Conditional Formatting
Problem
I have a report that lists all databases for which a full database backup has not been applied in the previous 24 hours from the time the report is run. When I originally created the report I had a manageable number of databases to support and I was the sole DBA. The environment has grown significantly since then. Furthermore, I now have a junior Database Administrator that will eventually be responsible for making sure backups are completing as required. When I was just in the DBA role I knew which databases were important and needed to have backup failures addressed immediately and which databases were test or training versions, or were of lesser importance. In short, I need to upgrade my report to provide a triage mechanism to responsible staff members that are not as familiar with the SQL Server environment as I am. How can I do so?
I have a report that lists all databases for which a full database backup has not been applied in the previous 24 hours from the time the report is run. When I originally created the report I had a manageable number of databases to support and I was the sole DBA. The environment has grown significantly since then. Furthermore, I now have a junior Database Administrator that will eventually be responsible for making sure backups are completing as required. When I was just in the DBA role I knew which databases were important and needed to have backup failures addressed immediately and which databases were test or training versions, or were of lesser importance. In short, I need to upgrade my report to provide a triage mechanism to responsible staff members that are not as familiar with the SQL Server environment as I am. How can I do so?
Solution
Let's start by taking a look at the initial design of the report as shown below. As you can see, due to the length of the report it may be difficult to discern which database backup failure I should look into first, unless I have a first-hand understanding of each SQL Server database (server and database names have been changed to protect the innocent - and myself).
Let's start by taking a look at the initial design of the report as shown below. As you can see, due to the length of the report it may be difficult to discern which database backup failure I should look into first, unless I have a first-hand understanding of each SQL Server database (server and database names have been changed to protect the innocent - and myself).

To address the need, I came up with the idea of
adding a priority field to a couple tables within my SQL Server metadata
repository. I added this field on the tables that contain my job,
instance and database metadata. I could not simply set one priority
status at the instance level, since I may (and do) have databases of varying
importance on my SQL Server instances. However, I could not set the
priority at only the database level since some SQL Server Agent jobs for a
"Very Important" database may not be all that important. I
think of the importance of backing up a database versus a job that posts
current connection settings to Reporting Services. Finally, I could not
simply set the priority at the job level, since there are many uses for reports
that require a triaging at the database or instance level that have absolutely
nothing to do with SQL Server Agent jobs.
That being said, I added this priority field to
tables at the three levels of Instance, Database, and Job that persisted
between refreshes of the SQL DBA Repository (the SSIS job that feeds this
repository runs three times per day and wipes clean most tables). Once
the database table structure was modified to account for importance of a
database I incorporated this new field into the data set that serves as the
source of the report's data.
The final step, was to add the conditional
formatting code to the BackgroundColor and Color properties for the text box
that contains the aging of the last database backup. This code looks to
the value of the Priority field in the report's data set. Where the value
of this field is equal to "High", the text box in the report will
show as red with white text for readability. Where priority is equal to
Low, the text box will be green with white lettering. Finally, all other
values for Priority would show as yellow, with black lettering. Below are
two screen shots with the logic.
BackgroundColor Property

Color Property

Now that the conditional formatting is in place and
the Priority field has been added to the report's data set, the same report
provides better insight towards triaging my response for backup assessment as
shown below.

A few commands in Reporting Services goes along way
to focus my team on the critical backups that need to be addressed on a daily
basis.
Article 12:
Report Parameters in SSRS 2008
What is Report Parameters in SSRS?
In SSRS, parameters are used to specify the data to use in a report, narrow down your report data for better analysis, connect related reports together, and vary report presentation. Report parameters can be Single-Valued and Multivalued.
Using Parameters in Reporting Services:
The most common use of parameters is to vary report data retrieved by dataset queries. In this scenario, users are prompted for a value or values when they run the report, and the dataset query retrieves only the data that is requested. You can change the report parameter properties in the report design tools to include a valid values list that displays at run time.
You can also create cascading parameters, which retrieve hierarchical data from a data source. I'll explain cascading parameters in my nect post. First I want to explain creating a report parameter in SSRS 2008.
Below are the uses of report parameters:
- To Control Report Data - by selecting required parameters values to filter the report data.
- To Control Report Appearance - use parameters to change report appearance using expression-based properties, including conditionally hiding report items and conditionally changing text color.
- To Connect to Other Reports - use parameters to link to drillthrough reports, subreports, and linked reports.
- To Select Specific Data Columns - parameters can be used to select specific columns of a table/matrix at run time.
How to create Report
Parameters:
Query parameters are added to a dataset query by way of the query designers or the Dataset Properties dialog box. After you create a query with parameters, Reporting Services automatically links query parameters to report parameters with the same name. Below are the steps to create parameters:
STEP 1:
To begin, start a new Report Server Project project in Visual Studio 2008 by clicking on Start --> All Programs --> SQL Server 2008 --> SQL Server Business Intelligence Development Studio. Then, from the menu, select File --> New --> Project to open New Project wizard. Now select Report Server Project from Visual studio installed templates and specify Name, Location and Solution Name.
I'll use the solution ctreated in my previous article. I'll use FirstReport.rdl for this example and I'll create a parameter Designation to filter report data for selected designations.
STEP 2:
Create a new Data Set for the report parameter. I will add a dataset dsDesignation for Employee's Designation using query
SELECT DISTINCT Desg AS Designation FROM Employee
as shown below:

STEP 3:
Now I will add a parameter Designation. In Report Data section, right click on Parameters node and click Add Parameter... as shown below:

STEP 4:
In Report Parameter Properties window, enter Name and Prompt of the parameter and select the Data type from dropdown box. For our example, enter Designation in Name and Prompt text boxes and select Text as data type.

STEP 4:
Now click on Avaliable Values to set available values for the parameter. Select Get values from a query. Select dsDesignation as Dataset, Designation as Value field and Label field.

STEP 5: Click on Default Values, Select Get values from a query. Select dsDesignation as Dataset, Designation as Value field. Click OK to save changes.

STEP 6:
Double click on your main dataset (dsMain) to open Dataset Properties. Now Select Parameters and click on Add button to map Designation parameter.
STEP 7:
Now final step, just add parameter in your query as shown in below snapshot:
WHERE [Desg] = @Designation

Now preview the report to check the action of parameter used:

Article 13:
Groups in SSRS 2008
In Report Designer, Groups
are created to organize data on the report or to calculate aggregate summaries.
An understanding how to define groups and use group features helps you design
reports that are more concise and communicate summarized data in a more compact
format.
We also use Groups in SSRS reports to provide Drill-down features. In this article, I'll walk you through SSRS Groups to create a report shown in below image:
We also use Groups in SSRS reports to provide Drill-down features. In this article, I'll walk you through SSRS Groups to create a report shown in below image:

STEP1: Add new report in Report
Server project and rename it to GroupsInSSRS.rdl.
Create new Shared DataSource for database AdventureWorksDW2008R2.
Click here to download AdventureWorksDW2008R2 database.
Create new Shared DataSource for database AdventureWorksDW2008R2.
Click here to download AdventureWorksDW2008R2 database.
STEP2:
Create a new dataset dsMain
with Shared Data Source. Use below query for this dataset:
SELECT
D.CalendarYear AS [Year]
,D.CalendarQuarter AS [Quarter]
,D.EnglishMonthName AS [Month]
,D.FullDateAlternateKey AS [Date]
,P.EnglishProductName AS [ProductName]
,C.FirstName + LastName AS [CustomerName]
,ST.SalesTerritoryRegion AS [SalesRegion]
,ST.SalesTerritoryCountry AS [SalesCountry]
,F.SalesOrderNumber AS [OrderNumber]
,F.SalesAmount
FROM FactInternetSales F
JOIN DimProduct P
ON P.ProductKey = F.ProductKey
JOIN DimCustomer C
ON C.CustomerKey = F.CustomerKey
JOIN DimDate D
ON D.DateKey = F.OrderDateKey
JOIN DimSalesTerritory ST
ON ST.SalesTerritoryKey = F.SalesTerritoryKey
STEP3: Drag and drop a table control and select CustomerName, OrderNumber, and SalesAmount fields in the table.

STEP4: Select table detail row --> Right click --> select Add Group --> Row Group --> Parent Group

STEP5: Select ProductName in Tablix group window and check add group header check box. Click OK and sace changes.

Now you can see Product Group in the table as shown below:

Delete Group1
Column and rename Customer Name
as Particulars. Select ProductName in Product
Group as shown below:

STEP6: Select ProductName group and add one more group for SalesCountry in similar way mentioned at step5. Delete the group column and select SalesCountry in CountryGroup as shown below:

STEP7: In the same way add Groups for the following Fields:
- SalesRegion
- Date
- Month
- Quarter
- Year
Finally
table will look like one shown in below image:

STEP8: we are done with report
Groups. You can Preview the report:

STEP9: Format Groups: This is the final step. Without
formatting the tabular data look meaningless and its very difficult to
understand the report. You can do following formatting to make it easier
to understand:
|
Group
|
Left Indent
|
BackgroundColor
|
|
Year
|
2pt
|
#7c73c8
|
|
Quarter
|
12pt
|
#9894ca
|
|
Month
|
22pt
|
#b4b4c8
|
|
Date
|
32pt
|
#c7c7d8
|
|
SalesRegion
|
42pt
|
#dadaeb
|
|
SalesCountry
|
52pt
|
#e7e7f0
|
|
ProductName
|
62pt
|
#f4f4fc
|
|
CustomerName
(detail row) |
72pt
|
White
|

Toggle
Groups:
Select Quarter
Group and click on Group
Properties. Select Visibility
in Group Properties and select Hide
option button. Check Dispaly
can be toggled by this report item check box and select Year from combo box.

Similar way toggle other report items.
Also Toggle Order Number column with Particular text box.
Now click on Preview and generate the report:
Thats all about Report Groups...
Cheers!!!
Article14:
Displaying Dynamic Columns in SSRS Report
Problem:
How to display selected columns dynamically in SSRS reports.
Example: A report contains more than 30 fields. Some users want to see only 5 fields, some users 10 fields, and other may want to see 20 fields.
Solution: Add a Report Parameter having the values as the name of all the fields of dataset. Now set hidden expression for each column of the tabular report.
Here is the solution with an example:
STEP1:
Create a report with required dataset. Drag and drop table control and select dataset fields.
In my example, I have following fields in the dataset: Year, Quarter, Month, Date, Product Name, Customer Name, Sales Region, Sales Country, Order Number, Sales Amount.
STEP2:
Create a dataset dsColumns using below query:
SELECT 1 ID, 'Year' AS ColumnName UNION
SELECT 2 ID, 'Quarter' AS ColumnName UNION
SELECT 3 ID, 'Month' AS ColumnName UNION
SELECT 4 ID, 'Date' AS ColumnName UNION
SELECT 5 ID, 'Product Name' AS ColumnName UNION
SELECT 6 ID, 'Customer Name' AS ColumnName UNION
SELECT 7 ID, 'Sales Region' AS ColumnName UNION
SELECT 8 ID, 'Sales Country' AS ColumnName UNION
SELECT 9 ID, 'Order Number' AS ColumnName UNION
SELECT 10 ID,'Sales Amount' AS ColumnName
STEP3:
Create a new parameter with name pDisplayFields and Promt Display Columns as shown below:

In Available
Values of Report
Parameter Properties wizard, select Get values from a query, select dsColumns in
Dataset, ColumName
in value field and label field.
In Default Values of Report Parameter Properties wizard, select Get values from a query, select dsColumns in Dataset, ColumName in value field.
STEP4:
Now you have to set the expression to display the colummns which are selected in the pDisplayColumn parameter. Right click on First Column (Year in my example) and click Column Visibility...

Write following expression in Show or hide based on an expression
of Column Visibility
wizard:
=IIF(InStr(JOIN(Parameters!pDisplayFields.Value,","),"Year")>0,False,True)
Now repeat this expression for all the columns by modify the expression for the respective column name accordingly.
Thats all. Now preview the report. You will see all the columns by default.
=IIF(InStr(JOIN(Parameters!pDisplayFields.Value,","),"Year")>0,False,True)
Now repeat this expression for all the columns by modify the expression for the respective column name accordingly.
Thats all. Now preview the report. You will see all the columns by default.

Now select required columns in Display Column parameter to modify the report layout at run time.

Adding Custom Color in SSRS Chart Reports
Do you ever come across a
requirement where you need to use user defined colors instead of default colors
in a chart (for example Pie Chart).
In this article, I'll explain how to create a Custom Palette and how to use that palette in a Pie Chart.
In this article, I'll explain how to create a Custom Palette and how to use that palette in a Pie Chart.

In the above screen-shot, I am
using color Blue, Red,
Teal and Gold
for the first four values of the Period
column and same colors are used in Pie Chart as well.
Here are the steps to achieve this task:
STEP1:
Create your custome color palette in the report using Custom Code in your report. To do so, click Report => Report Properties => Code and copy below code:
Private colorPalette As String() = { "Blue", "Red", "Teal", "Gold", "Green","#A59D93", "#B8341B", "#352F26", "#F1E7D6", "#E16C56", "#CFBA9B"}
Private count As Integer = 0
Private mapping As New System.Collections.Hashtable()
Public Function GetColor(ByVal groupingValue As String) As String
If mapping.ContainsKey(groupingValue) Then
Return mapping(groupingValue)
End If
Dim c As String = colorPalette(count Mod colorPalette.Length)
count = count + 1
mapping.Add(groupingValue, c)
Return c
End Function
You can define your own colors in the above function.
STEP2:
In the Pie Chart, select Series Properties and select the Fill option from left side as shown below:

Now write following expression in the Color expression:
=code.GetColor(Fields!Year.Value)
Here Fields!Year.Value is a field of dataset which is used as Chart Category fields.
STEP3:
In the left most column of the tabular report, insert character █ and in the color property of the textbox write following expression:
=code.GetColor(Fields!Year.Value)
Here I am considing that tabular report is grouped on Fields!Year.Value field.

Dynamic Color Coding in SSRS Charts
In this article, I will explain
how to change the
color of a chart dynamically. In other words, how to provide
custom color palette
feature at run time.
Lets start off with an example including step by step operations.
Step1. Open or create new Report Server Project. I am creating a new Report Server Project using SQL Server 2012 and saved it with LearnSSRS2012 name.
Step2. Add new Shared Data Source by right click on "Shared Data Sources" folder.
Lets start off with an example including step by step operations.
Step1. Open or create new Report Server Project. I am creating a new Report Server Project using SQL Server 2012 and saved it with LearnSSRS2012 name.
Step2. Add new Shared Data Source by right click on "Shared Data Sources" folder.

Now give any name to Share Data Source (Local, in my
case) and click on Edit button to define Server Name and Database Name. In this
example, I will use static data sources so I am using "." (you can
also use "(local)") as ServerName. I am not defining any Database
name so I will keep it blank (default will be msater). You can define any
database, if you want. Now click on OK.

Step3. Now create a new report by clicking on Reports --> Add --> New Item --> Report --> Add. I don't like default report name like Report1, Report2, Report3 so I have renamed it to ChartColorCode.rdl.
Step4. Create Data Source for ChartColorCode report. To create a new Data Source, right click on "Data Sources" followed by "Add Data Sources" under Report Data as shown below:

We will use Shared Data Source we created above. So click on "Use shared data source reference" and select Local data source created at step 2. Give any name to this report level data source. I will assign "Local" again. Click OK to proceed.

Step5. Now lets create couple of datasets. To create a new dataset, right click on "Datastes" followed by "Add Datastes" under Report Data as shown below:

I will use two data sources in this example, one for Color Palette and another for Chart.
To create new Dataset for ColorPalette, Right click on DataSets --> Add Dataset... and type "ColorPalette" in Name textbox. Select "Use a dataset embedded in my report" option and select Local as Data Source.

Select Text option in "Query Type" and type following query in Query window:
SELECT 'Red' AS ColorName UNION
SELECT 'DarkOrange' AS ColorName UNION
SELECT 'Green' AS ColorName UNION
SELECT 'Blue' AS ColorName UNION
SELECT 'Olive' AS ColorName UNION
SELECT 'SeaGreen' AS ColorName UNION
SELECT 'Brown' AS ColorName UNION
SELECT 'Gray' AS ColorName UNION
SELECT 'Tomato' AS ColorName
Click OK to proceed.
Create one more dataset using following query and name it Chart.ds:
SELECT 2010 AS [Year], 12000 Amount UNION
SELECT 2011 AS [Year], 15000 Amount UNION
SELECT 2012 AS [Year], 13000 Amount
Step6. Drag and drop "3D Cylinder" bar chart from toolbox. Drag and drop Amount field from Chart.ds to value field (Y axis) and Year field to Category Groups as shown below.

To make the chart more meaningful and dainty, do following formatting:
1. Replace Chart Title with "Year vs Amount".
2. Replace Y Axis Title with Amount.
3. Repalce X Axis Title with Year.
4. Remove the Chart Legend.
5. Change the font size and color as you wish.
6. Right click on the bar and select "Show Data Labels". Select Times New Roman in data labels font because numbers are better visible in this font.
After incorporating all the above changes, click on Preview tab to view the report. My report looks like one shown below:

Step7. Now I will explain how to change the chart color at run-time.
First of all, I will create a report parameter for dynamic color. Click on Parameters folders in Report Data and then click on Add Parameter... Define pColor as report parameter Name and Color as Prompt. Select parameter visibility Hidden. You can keep it as Visible if you wish to do so.

Click on Available Values under Report Parameter Properties window. Select "Get values from a query" option under "Select from one of the following options". Select ColorPalette in Dataset box, ColorName in "Value field", and ColorName in "Label field".
Click on Default Values under Report Parameter Properties window. Select "Get values from a query" option under "Select from one of the following options". Select ColorPalette in Dataset box, and ColorName in "Value field". Click OK to proceed.
Step8. Drag and drop Table control from toolbox.
Do set following properties for table control.
a) Table control will have three default columns. Delete one column.
b) Merge Table Header and write "Color Palette" in the textbox.
c) Write following expression in the second column of Table Details.
=IIF(Parameters!pColor.Value=Fields!ColorName.Value, "◄","")
and write following expression in background property of same text box:
=Fields!ColorName.Value
d) Select Table Details and then right click --> select "Row Group" --> select "Group properties"

e) In "Group Properties" window, click on expression button under "Group on" box and write following expression =Fields!ColorName.Value.

f) Select first text box of Table Details and then right click to select "Test Box Properties" as highlighted below:

g) in "Text Box Properties" dialogue box, click on Action and select "Go to report" under "Enable as an action" and "ChartColorCode" in "Specify a report" box. Also select report parameter pColor in Name and [ColorName] in Value as shown below:

Step9. Now we are at the final step where we need to change the properties of bar chart to change the color at run time. Right click on bar chart and select "Series Properties".

In "Series Properties" window, click on Fill. and then click on expression button to open Expression window. Double click on pColor under parameter or write following expression manually as shown below:
=Parameters!pColor.Value

Step10. Its time to run the report and see the results.
First Preview:

Second Preview: Following report will be displayed once we click on Red color under:

Third Preview: Following report will be displayed once we click on DarkOrange color under:

Beginning SQL Server 2005 Reporting Services Part 1
Building and deploying basic reports
If ever there was job for "real" developers to shuffle
to their juniors, it is building reports. It's not real development anyway;
it's more like glorified formatting. Besides, the esoteric tools that you use
to build reports try to provide an abstraction layer, which often prevents you
from having any real control over the report. I've heard all these arguments
before. If this sounds like a conversation you've had by the water cooler, then
I invite you to take a closer look at SQL Server 2005 Reporting Services
(SSRS).
SSRS 2005 is the latest version of SQL Reporting Services, and ships with
all versions of SQL Server 2005. SSRS allows you to quickly and easily create
reports from multiple database sources. The finished reports can be presented
directly from the reporting services website, or they can be displayed in your
web- or Windows-based applications. Reports can be exported to multiple
formats, including comma delimited text, XML, portable document format (pdf)
and Microsoft Excel.This article is the first of four parts, which will provide in-depth coverage of SQL Server 2005 Reporting Services:
- Part 1 covers the basics of the SSRS. It demonstrates how to build quick, simple reports and will familiarize you with the basic Report Designer environment
- Part 2 will cover use of custom functions, aggregate functions, sub-reporting, the matrix control, drill-downs, and sorting.
- Part 3 will take an in-depth look at the charting control
- Part 4 digs into the actual Report Definition Language (RDL) and the new Report Builder tool.
Installing and configuring Reporting Services
After much debate, we decided that full installation and configuration details were outside the scope of an article focused on how to build basic reports using SSRS, especially as there are already several online resources that treat this area in detail. See, for example:http://msdn2.microsoft.com/en-us/library/ms143736.aspx
and
http://www.awprofessional.com/articles/article.asp?p=357694&seqNum=1&rl=1
Well worth reviewing are the details in the latter on the need to install SSL on any machine hosting SSRS.
---Editor's installation notes---
In order to test the reports in this article, I went through a single-machine installation on Windows XP (meaning that SQL Server 2005, Reporting Services, and much more, are all installed on my poor laptop). Since I didn't install SSRS when I installed SQL Server 2005 (I didn't have IIS installed at the time), I had to first install IIS 5.1, and then Reporting Services (from the SS2005 disks). I then jumped immediately into Reporting Services Configuration Manager tool (All Programs ¬ SQL Server 2005 ¬ Configuration tools). The left panel acts as a sort of checklist of items to configure:

All went well until the Database Setup. Because I had not installed SSRS at the same time that I installed SQL Server, the ReportServer and ReportServerTempDB were not created by default. These databases hold all the report definitions and reporting server configuration information. Connecting to SQL Server using Service Credentials, the databases appeared to be created, but I received an error suggesting that I didn't have permissions to perform the requested task, and a red cross remained next to the Database Setup icon. This had me stumped for a while – eventually I appeared to solve it by hopping to the Server Status section, stopping the Report Server, opening SSMS and deleting both the ReportServer and ReportServerTempDB databases, and then restarting the Report Server and trying again! Even though I swear this didn't work the first time I tried it, it seemed to do the trick the second time (while I was on the phone moaning to Steve that I couldn't get it to work!). However, I'm still not clear why I had the problem in the first place – or why it suddenly went away.
This wasn't quite the end of my problems. Installing SSRS creates two new virtual directories under the default website on IIS. By default, they are named Reports and ReportServer. The ReportServer site hosts a web service for running and managing reports. The Reports site allows you upload reports from a browser and run reports over the web. When I tried to navigate to http://localhost/ReportServer I received the following error: "Failed to access IIS metabase". Fortunately, the information on the error page is quite useful (for a change) and this, coupled with a quick Google search, led me to grant access to the metabase to the ASPNET user account by executing the following from the directory housing the aspnet_regiis executable (WINDOWS\Microsoft.NET\Framework\v2.0.50727, in my case):
spnet_regiis -ga ASPNET
-----End of Editor's note----
Once you've completed the installation and configuration process, the first thing to do is download the code file for this article (see the Code Download link in the speech bubble to the right of the article title). The code file contains a sample Visual Studio project and a SQL Script for creating the ReportDemo database. You will need this database if you want to follow the examples in this series of articles so go ahead and create the database using the ReportingDemoDatabaseScript.sql script or, alternatively, by restoring the provided ReportingDemo.bak file.
If you are using SQL Server Authentication on your SQL Server you will also need to set up a login with permissions to the ReportDemo database (for the examples, I set up a login called DemoUser as a DBO on my ReportDemo database).
Using the Report Wizard
There are two ways to create SSRS Reports. You can build the report manually, or you can use the Report Wizard to give yourself a head start. For this first report, we are going to take advantage of the wizard. Start a new Business Intelligence project in Visual Studio 2005. Then, from the menu, select Project > Add New Item. Select the Report Wizard option and call the file "FirstReportWZ.rdl". Click Add. Click Next on the Welcome screen and this will bring you to the Select the Data Source screen:
Select the New data source radio button and give the data source a name. Select Microsoft SQL Server as the type.
Note:
Use of the Shared data source option is actually a better option in most cases but, for the sake of this example, we will just create a new data source. We're going to set up a shared data source later in this article.
Click the Edit button to bring up the Connection Properties dialog:

Enter or select a server name. The default is to log on using Windows Authentication. If you are using SQL Server Authentication, choose that setting, and enter the username and password. Finally, select a database, in this case ReportingDemo. Make sure you test the connection before you click OK.
Next up is the Design the Query screen. You can use the Query Builder by clicking the button at the top left, but in this case simply enter "Select * From Customer" into the Query string text box and click Next. On the Select the Report Type simply select the type you prefer (tabular or matrix) and hit Next.
This brings up the Design the Table screen:

Select State in the Available fields box and click the Group button. This will group the data in the result set by State. Select Next. On the Choose the Table Layout page, select the Stepped option and check the Enable Drilldown checkbox. On the next screen, choose a style for your report (I chose Ocean) and click Next.
This brings up the final screen, Completing the Wizard:

It shows a summary of your report options, and gives you an opportunity to rename the report and to preview it. Click Finish to end the wizard.
You should be shown the report in the standard Report Designer:

There are three tabs: Data, Layout and Preview. You should be on the Layout tab. Click on the Preview tab to view the report. Since this report doesn't take any arguments, it will run as soon as you click on the tab.

Use the +/- symbols next to the State abbreviations to expand and collapse the grouping of the report.
Manual report creation
The previous section, while perhaps overly simplistic, does show you how to get a report up and running with zero code and zero property setting. Obviously, such reports will not meet most development requirements, but do not discount this option as a starting point for more complicated reports. Once you've created a report with the Report Wizard, you are free to make any modifications to it.In this section, we are going to create a more realistic report from scratch, including how to create and use a shared data source object, stored procedures, and how to format your report, set report properties and use report parameters.
Creating a shared data source
Before we start the report, we are going to build a shared data source i.e. a data source that is common to, and can be used by, all of the reports on a reporting server. While each report can contain its own connection information, it is good practice to use shared data sources, as it will save you a lot time and headaches. This way, you only have to set the connection information once. For example, let's say your company has Development, Test and Production environments. If you put the connection information into each report, you will have to change it each time when you publish to Development, Test and Production. If you use a shared data source, you still have to set up a data source object for each of three environments, but you can simply publish the report to each environment, and they will automatically use the connection information associated with that environment.From the menu select Project > Add New Item > Select Data Source. On the General tab, call the data source "ReportsDB". Leave the Type as Microsoft SQL Server. Click the Edit button on the right, and enter the connection information for Reporting Demo, as before. Click OK on the Shared Data Source screen and the data source is done.
Add a new report
From the menu select Project > Add New Item. Select Report and name it "FirstReportMan.rdl". A new report will be added to the project, and the Report Designer will open at the Data tab. At this point, let's take a closer look at the Report Designer tool. At the top of the Report Designer window are three tabs: Data, Layout and Preview. The Data tab is used to build data sources for your report. The Layout tab is the physical report designer where you set up the header, the footer and the data presentation of the report. The Preview tab allows you to actually run the report from Visual Studio 2005, without having to publish it to a report server first. If your report takes parameters, the Preview tab will ask you to fill them out before it runs the report.The first thing we need to do is get data into our report. At the top of the Data tab choose <New Dataset…> from the dropdown list:

The Dataset dialog opens:

Name the dataset "ReportData", and select the ReportsDB data source from the dropdown. Select StoredProcedure as the command type, and enter "spr_CustomerSelectAll" in the query string box. Click OK to close the dialog.
Note:
spr_CustomerSelectAll is a very simple, parameter-less stored procedure that selects all of the columns from the Customer table. The source code is included in the ReportingDemoDatabaseScript.sql script with the code download.
Test the dataset by clicking on the big red exclamation point at the top of the report designer. This executes the query and displays the results. You can repeat these steps if you wish to add multiple datasets to your report.
Setting up the report display
Next, switch to the Layout tab. This is where you actually build the report display. Start by dragging a table from the Toolbox, onto the Body section of the report. By default, the table shows a header row at the top, a detail row in the middle and a footer row at the bottom. You can add additional columns to the table by right-clicking on one of the columns and selecting one of the two Insert Column options.Click on the Datasets tab under Toolbox on the left-hand side of the Visual Studio environment. You should see the ReportData dataset. Expand it, select FirstName and drag it to the first cell of the body row of the table. This will display the First Name field in the first column. Now put the LastName in the second column, and the CustomerStatus in the third:

Note that, when you drag the column FirstName into the body row of the table, SSRS make a guess as to what to call the row. It calls it "First Name". You can click on the Preview tab to view the report.
Adding formatting
OK, so we have a basic, very plain, report. Let's add some formatting to make it look good. Let's add the DateOfBirth column to the table. You can expand and shrink the size of the columns by highlighting and dragging:
If you wish to get rid of the footer row of the table and then click on any field in the table. You will see a grey box surround the table. Right-click on the icon at the beginning of the body row and then click the Table Footer option to deselect it.
The table header is next. To format all the cells in the header in the same way, click and drag over all the cells to select them. Open the Properties window and set background color, font, and so on.

Note, however, that if you wish to change the justification of the text or the size, then you do so using the main menu at the top, not via the properties window. Again, you can click on the Preview tab to view the report.
Add a report header
The table already has a header, but the report can also have a header and footer. Report headers and footers appear on every page of the report. Put the Report Designer in Layout mode and select Report > Page Header from the menu. A new band labeled Page Header appears on the report above the body. Drag a text box onto the header and click directly on it. Type "My First Report", not in the Properties window, but right on the control.
To adjust the text style and size of your heading, highlight the text box and use the option from the top menu.
Formatting
Each field can have formatting. Let's deal with that ugly Date of Birth field. The time information is superfluous, so let's format the date properly. Right-click on the cell that contains the date of birth, and choose Properties. Next, select the Format tab.
Click on the second button (labeled "…") to the right of the Format code field. When the dialog opens, use the standard options. Select Date in the list on the left, then choose the sample date format you want on the right. Click OK to close the dialog.

Click OK to close the Properties window and then click on the Preview tab to view the report.
Setting report properties
To access the report properties, you need to be on the Layout tab of the Report Designer. When you click on this tab, a new menu item, Report, activates. This menu gives you options for turning on and off the report header and footer sections (as we have seen), adding embedded images, setting report properties, and setting report parameters.Setting up the report print settings is not intuitive, compared to other products. In the report Layout tab you see your report with a ruler across the top. That ruler is set up in inches. A standard sheet of paper is 8.5 x 11 inches. The default setting in SSRS is to have a 1-inch margin all the way around the content area. So, at 8.5 inches wide with a 1-inch margin on the left and another on the right, you have 6.5 inches for content. Any more, and the content beyond the 6.5 inches will spill over onto a second sheet of paper when printed. It will not automatically shift to Landscape.
To get Landscape reports, you have to make the proper report settings. Navigate to the Layout tab of the Report Designer. From the Report menu select Report Properties. Switch to the Layout tab of the dialog box. To switch to Landscape printing, you need to change Page width to 11in and the Page height to 8.5in.

On the same Layout tab, you can also get up your report to display the data in multiple columns, and you can control the margins. By default, all the margins are set at 1 inch. Remember, if your report width, plus the right and left margins, is greater than the width of the printer, you will get spill-over when you print out your report.
Using parameters
There are two ways to add parameters to your reports. The first is to use parameters in the queries in your data sources. The second is to set up parameters through the Report Parameters dialog box. We will do both.Query parameters
First, we will set up parameters using a data source query. Navigate to the Data tab, and click the "…" button right next the Dataset dropdown box. The Dataset dialog box opens and allows you to edit the query for the dataset. Change the Query string from "spr_CustomerSelectAll" to "spr_CustomerSelectByState".Note:
spr_CustomerSelectByState accepts a parameter called StateCD that allows us to filter the data from the Customer table by State. Again, the source code is included in the ReportingDemoDatabaseScript.sql script with the code download.
Click OK and then run the query by clicking the red exclamation point (!) on the Data tab toolbar. You will be prompted to enter a parameter value for StateCD (the State code). Enter "CA" and click OK. The query should return all the customers that live in California.
Switch to the Preview tab. Instead of the report just running, there should be a place for you to enter a value for the "StateCD" and run the report. Enter "CA" and click the View Report button. You should see your report filtered by state.
To edit the parameters, or to add new ones, switch to the Layout tab of the Report Designer and open the Report Parameters dialog from the Report menu. First, we are going to make the "State code" prompt a little more friendly. Select StateCD in the Parameters list box then, in the Parameters Properties box, change the prompt to read "State". In the Available values section enter "California" and "CA" on the first line. Enter "Louisiana" and "LA" on the second line.

This will make the prompt for "State value" into a dropdown. You can also build additional datasets into your report, and use the values in those datasets as criteria for dropdowns.
Report parameters
Now let's add a parameter that is not used in a query. Click the Add button in the Report Parameters dialog from the Report menu. Give the new parameter the name "ReportTitle". Its Data type should be String. Set the Prompt to "Report Title". Click OK and close the dialog box.Drag a new text box onto the report header area. Right-click on it and choose the Expression option. In the Edit Expression dialog select Parameters. Double-click on the ReportTitle parameter. This text box will now display the value you pass to the Report Title parameter.

Switch to the Preview tab and try it out.
Publishing your reports
Up to now, you have been running your reports in the Visual Studio 2005 environment but, to make them useful, you must publish them to a report server. The easiest way to do this is to have Visual Studio publish your reports.Start by right-clicking on Project in the Project Explorer and choose Properties.

Set TargetServerURL to the URL of your report server. Use the TargetReportFolder property to set up a folder for your reports. If the folder does not exist, the Publisher will create it for you. The other key thing to pay attention to here is the OverwriteDataSources property. When this property is set to "True", it will automatically copy over all your data source objects when you publish. When set to "False", it will copy any new data source objects, but it will not overwrite existing ones. This is important when dealing with development, test and production servers. You can publish a set of data source objects to each server, pointed at the correct database, and never have to worry about what database your reports are hitting in each environment.
From the Build menu select Deploy Solution. This will publish the project to the selected folder on your report server. You can also deploy individual reports by right-clicking on the file in the Solution explorer and selecting Deploy.
Once your report has been published, you can access and run it on your server through the browser at http://<servername>/<reportservername>. From the Home page, you should be able to find the folder you published to, with the reports in it. Select a report to run. At the top of the page you can enter any values for report parameters, and then run the report. From here, you can also print or export the report.
Wrap up
That's everything you need, to build a very basic report. In the next articles we'll get into adding some more advanced options such as drill-downs, sorting and custom functions. Stay tuned.
Steve Joubert continues this introductory article in Beginning
SQL Server 2005 Reporting Services Part 2. If you enjoyed this article,
make sure you see Ten
Common SQL Server Reporting Services Challenges and Solutions and
other Reporting Services articles in our Reporting Services
section.
Beginning SQL Server 2005 Reporting Services Part 2:
In Part
1 of this article, we looked at the basics of SQL Server Reporting
Services 2005 (SSRS). We built one report with the Report Wizard, and one
report using the Report Designer. In Part 2, we are going to look in more depth
at the features that you can use everyday as an SSRS developer.
We will investigate:
- Use of expressions that allow you to dynamically control nearly every aspect of reporting from control properties to data binding
- Common functions that allow run calculations and manipulate data within the report itself
- Custom code, used to build your own library of functions within the report.
Getting started
In order to follow my examples, you will need to have SQL Server 2005, SQL Server 2005 Reporting Services, and Visual Studio 2005 correctly installed and configured. If you need some help with this, please refer back to the links in Part 1 of this series. Next, download the code file for this article (see the Code Download link in the speech bubble to the right of the article title). The code file contains a sample Visual Studio project and a SQL Script for creating the ReportDemo database. If you've not done so already, go ahead and create the database using the ReportingDemoDatabaseScript.sql script or, alternatively, by restoring the provided ReportingDemo.bak file.Now start a new Business Intelligence project in Visual Studio 2005 (or using BIDS, which installs with SQL Server 2005). Select Project | Add Existing Item function to add to the project the shared datasource (ReportDb.rds) and the sample report, FirstReportMan.rdl. Next, open up the shared datasource and set the server, database, login and password to point to your copy of the database. We will start with the FirstReportMan.rdl report, so double-click on it in the solution explorer to load it into the designer.
Expressions
An expression is a short statement, written in code, which sets the value of a property. An expression can set the value of a property based on just about any data available in the report: parameters, report global values, fields in a dataset, and built-in functions.SSRS 2005 has made some drastic improvements in how expressions are created. It now supplies an intuitive expression editor. If you scroll through the Properties window, you will notice that most of the properties of controls on the report can be hard-coded or can be set through expressions. (That's the <expression> option you see everywhere.) You will also see buttons labeled fx in the pop-up Properties dialog. These buttons will access the expression editor.

The expression feature makes SSRS 2005 into an incredibly versatile tool, because it allows most aspects of the report, from the data it shows to how it shows it, to behave dynamically. Rather than using a hard-coded value for a particular property, the SSRS resolves the expression to set the value for the property.
Looking at our report, let's say we want it to highlight all the customers from a particular State. We could use the expression:
=iif(Fields!State.Value = "CA", "Bold",
"Normal")
If we apply this expression to the detail row in the table and run the
report it will bold the text for each row where the value of the State field is
California. That's great if the data from California is all that you are
interested in. However, it would be ridiculous to have one report for each
state, so let's make this expression even more dynamic by adding a report
parameter that will determine which State is highlighted when the report is
run. First, let's add the new parameter to the report. Open the FirstReportMan.rdl report and navigate to the Layout tab. From the Report menu select Report Parameters. When the dialog window opens, click the Add button at the bottom of the screen. Call the new parameter 'HighlightState' and set the available values as follows:
|
California
|
CA
|
|
Florida
|
FL
|
|
Louisiana
|
LA
|
|
Illinois
|
IL
|
|
Texas
|
TX
|
Note:
You'll see that when setting up a list of pre-defined values for a parameter that there is a 'From Query' option. You can use this option by defining a dataset on the data tab of the report designer. For example, if we had a State table in the database we could define a dataset to retrieve the data for the parameter dropdown from that table. Once you choose the 'From Query' option, you select the dataset, the value field (this is the field from the dataset that contains the value passed to the report) and the label field (the field from the dataset that contains the value displayed to the user when they are prompted for parameters).
The next step is to set up the expression. Click on the table control on the report. When the table control is selected, an extra control tab appears at the top and left of the table. Click on the little 'row maker' icon, just to the left of the detail row. This allows you to set properties for the entire row. In the properties window select FontWeight and choose <expression> from the drop-down list to open the expression editor. Typing =iif( should give you Intellisense. You can use the expression builder to create the following line of code:
=iif(Fields!State.Value = Parameters!HighlightState.Value, "Bold",
"Normal")

The iif is a flow control statement commonly used in SSRS expressions. Its format is:
iif (boolean statement, true result, false result)
If the boolean statement is true, then the true result is returned, and if not, the false result is returned. In this case, the boolean statement is asking: 'Does the state code equal the state code that was passed to the report? If it does, return the word 'bold'. If it does not, return the word 'normal''. The value returned is then used to set the property for that instance of the row.
Now switch to the Preview tab and select a State to highlight. When the report runs, all the rows with customers from the selected State should be displayed in bold.
Common functions
Let's navigate back to the expression editor. In the bottom half of the
screen there are three columns. The first column lists different categories for
building expressions. The last option is Common Functions. Expand the Common
Functions node. Click on the Date & Time category. In the next column,
double-click on one of the functions. You will see that it is added to the
expression box at the top of the dialog box. Next, simply put the cursor in the
expression box after the function. If you then type in the opening left
bracket you should instantly see Intellisense for the function you
selected.
Let's use the Year function in the report to display only the year in which someone was born, instead of their full birth date. Right-click on the field that displays the date of birth and select Properties. On the General tab, find the Value field and click the fx button to bring up the expression editor. Change expression to read.
=Year(Fields!DateOfBirth.Value)
There we have it. It's a good idea to preview the report now.Also of note here are the aggregate functions. These functions assist you in working with all of the data in a dataset. For example, let's say your report is an order form with a list of items and their prices. You can use the Sum function on the Price field to create a total price on the report. In a different example, if you had a report that listed all the purchase dates and the total amount of each purchase, you could use the AVG function to get the average purchase price for that customer.
Global variables
Let's go back again to the expression editor. This time, click on Globals
in the first column of the expression editor. In the second column, you will
see the list of the global variables that are provided to the report. In this example, we are going to use the global variables to create a page-numbering scheme for our report. First, add a footer to the FirstReportMan.rdl report. You enable this by going to the Layout tab and selecting the Report Footer option from the Report main menu. Now that you have a footer, drag four text boxes into the footer section. Set their font properties to 8 pt, bold. Set the text for each text box as follows:
|
Page
|
|
=Globals!PageNumber
|
|
of
|
|
=Globals!TotalPages
|
Some other globals worth noting are:
- ExecutionTime – this tells you how long it took to run the report
- ReportServerUrl – this allows you to verify that you are getting your report from the correct source
- UserID - this shows under which User ID the report was run
Custom functions
There are about 100 common functions in SSRS 2005, and they can handle most
of what you will need to do. Occasionally, however, you will still need to set
an expression with more control than the common functions can manage. So, to
make SSRS even more flexible, you can write custom VB.NET or C# functions and
use them in expressions.Now we are going to add a custom function to the FirstReportMan.rdl report.
Open the report and navigate to the Layout tab. From the Report menu select Report Properties and then jump to the Code tab. We are going to write a custom function that returns a different color, depending on the value that is passed to it. We will then use that function to set the background color for the status field in the report detail table.
Copy the following code into the code window:
Public Function GetColor(ByVal status as String) as String
IF status = "100" Then
Return "White"
End IF
IF status = "101" Then
Return "Yellow"
End IF
IF status = "102" Then
Return "Tomato"
End IF
End Function
Click OK and close the window.
Note:
The full list of available colors is found in the Color dropdown list in the properties window.
Now that we have a function that returns color names we need to wire up that function to an expression. Click on the Customer Status cell and open the Properties window. Find the Background Color property and choose Expression from the dropdown. Add the following line of code to create an expression:
=code.GetColor(Fields!CustomerStatus.Value)
When the report runs and this expression is resolved, SSRS will call your GetColor
function and pass the value of the customer status for that instance of the row
to the function. The function takes over and decides which color should be
returned. SSRS then uses that value as the value for the background property
for that cell.
Please note that custom functions must be called using =code.<myfunction>.
Now navigate to the Preview tab and run the report..
Subreports
A subreport is a report that is embedded into another report. Subreports can
take parameters and execute their own datasets. A key aspect to note is that a
subreport in SSRS is actually just another report (unlike some reporting tools,
where a subreport is a special construct). In fact, in SSRS you can execute a
subreport on its own. To add a subreport to a report, you simply drag a subreport control onto the report and tell it which report to display. If the subreport requires parameters, you have to tell the main report which value to pass to the subreport. It's actually very simple.
Let's add a new report to the project and call
it MainReport.rdl. Create a new dataset using the shared datasource and
the query:
SELECT CustomerID, FirstName, LastName FROM Customer
Switch to the Layout tab. Drag a table on the report detail area. Set
up the first column to display the customer's first name (by dragging that
column from the Datasets tab into the Detail row) and set up the second column
to display the customer's last name. Label the third column 'Address'. Preview
the report, just to be sure it works.Create another report, and call this one MySubReport.rdl. This time, create a dataset that uses the shared data source, and use the following query text:
SELECT Address, City, State, ZipCode
FROM Customer
WHERE (CustomerID = @CustomerID)
In the Layout tab, use text boxes to create the address layout, as shown in figure 5. You can simply drag the text boxes onto the screen by clicking on the field in datasets tab and dragging it onto design surface. You will also note that when you do this, the expression used to set the value property for the textbox uses the First() function. This function will use the value from the first row returned by the dataset. All other rows returned are ignored.

Now preview the report and use '100' for the CustomerID parameter.
Let's jump back to the MainReport.rdl. To embed the subreport, drag a SubReport control into the detail cell for the column you labeled 'Address'. Right-click on the SubReport control and select Properties. In the Properties dialog choose MySubReport from the subreport dropdown.

Next, switch to the Parameters tab. This is where you connect your subreport to the main report. You do this by indicating which value from the main report is to be passed to the subreport to fulfill its parameter requirements.
In the Parameter Name column choose CustomerID and in the Parameter Value column choose =Fields!CustomerID.Value. This will wire up the subreport to whichever customer is being displayed in the row of the table.

Click OK to close the dialog, and then preview the main report.
The Matrix
It's this question that drives us, Neo. What is the Matrix? OK, I'll
stop right here. You can insert your own slam to the second two movies.
However, there is a really cool control in SSRS called the Matrix control.
The Matrix is used to create pivot table style reports. We are going to set up
a simple Matrix control to show us which customers, in which State, have
which status.First, start a new report called MatrixReport.rdl. Add our standard dataset where you use the shared data source, and then add the Select * from Customer query.
Navigate to the Layout tab and drag a new Matrix control onto the page. Where it says Rows, drag the State field from the dataset. Where it says Columns, drag the CustomerStatus field from the dataset. Drag first name and last name into the data area on the Matrix control. After a little formatting, it should resemble this:

When the report runs, it looks like this:

Adding drill downs
The drill down functionality in SSRS allows you to have areas of your report
that can expand and collapse, much like a tree view.First, start a new report called AdvancedTable.rdl. Add our standard dataset, where you use the shared data source and the Select * from Customer query.
Navigate to the Layout tab and drag a new table control onto the page. The first thing we need to do is to add a group to the table. Click the table to highlight it, then right-click on the little box with three horizontal lines in it that appear at the left side of the table at the beginning of detail row. Select Insert Group. When the Group Dialog appears use =Fields!State.Value as the expression, so that the report now groups on State. Now drag the State field into the first column on the Group row. Next, drag the First Name, Last Name and City fields into the detail row. Add some formatting, and preview the report.

We've now performed a grouping, but we still have to enable the drilldown. Click on the table to highlight it. Right-click on the nub that appears, just to the left of the detail row. Select Properties. When the Properties window opens, expand the visibility section. Set the Hidden property to True and set the ToggleItem property to State. The Hidden property determines the state of the row when the report is first run. If we set it to True then the data is collapsed and hidden. By setting the ToggleItem property to Statee, when the report is run a little + sign appears next to it when the report is run and it works like a tree view.
Switch to the Preview tab and run the report. Now only the States appear, but you can see the customer in each State by using the tree-style +/- controls.

Adding dynamic sorting
It is incredibly easy to add sorting to your table. Let's re-open the FirstReportMan.rdl
report. Navigate to the Layout tab of the report designer. Click in the
cell labeled First Name in the header of the table. Right-click and
select Properties. Switch to the Interactive Sort tab. Check the
checkbox for 'Add an interactive sort action to this textbox'. Next, set the Sort
expression to the value that is displayed in the column – in this case =Fields!FirstName.Value. Now repeat this process for
the rest of the report.
Preview the report, and you should have interactive sorting on each column.

Wrap up
I hope this look into some of the more advanced features of SQL Server
Reporting Services 2005 will help you make your reports more interactive and
better adapted for your users. In Part 3, we will take an in-depth look at the
chart control and its diverse set-up functionality.
Steve Joubert continues this introductory article in Beginning
SQL Server 2005 Reporting Services Part 3: The Chart Control. If you
enjoyed this article, make sure you see Ten
Common SQL Server Reporting Services Challenges and Solutions and
other Reporting Services articles in our Reporting Services
section.
If you found Steve's article useful…you may be interested in Red Gate's SQL Doc, a fast, simple documentation solution for SQL Server 2000, 2005 and 2008 databases.
If you found Steve's article useful…you may be interested in Red Gate's SQL Doc, a fast, simple documentation solution for SQL Server 2000, 2005 and 2008 databases.
Beginning SQL Server
2005 Reporting Services Part 3: The Chart Control:
This is Part 3 of a four-part article series on SQL Server Reporting Services
2005 (SSRS). Part
1 provided a step-by-step guide to basic report creation and Part
2 took a tour of some of the core SSRS features and functions that you'll
need to develop dynamic reports. Here, we turn our attention to the chart
control that ships with SSRS.Microsoft's chart control is, in fact, a scaled-down version of the Dundas Chart Control. Scaled down or not, as far as built-in controls go, I have to say that this one is pretty impressive and feature-rich. For many people, this feature alone constitutes a pretty good reason to adopt SSRS.
In this article we will set the chart control on a report and populate it. We will also cover the different charting display options and I'll demonstrate some rather cool formatting techniques.
Getting Started
Now that we have reached Part 3, I'm going to assume that you've installed all the software you need to follow through the examples, that you have created the ReportingDemo database in SQL Server and have also mastered the basics of creating basic reports, data sources and datasets. If any of these assumptions make you feel nervous, please work your way through Part 1 (at least) and then come back.NOTE:
You can download the code file for this article from the Code Download link in the speech bubble to the right of the article title. The code file contains a sample Visual Studio project with all the reports from this article, along with a .bak file (or, alternatively, a SQL Script) for creating the ReportingDemo database.
Ed.Note:
The BAK file provided with part 1 of this series accidentally omitted the Purchase table. If you created the ReportingDemo database from that BAK file (as I did) then you will need to run the provided ReportingDemo_Update script to create and populate the Purchase table.
Creating a basic chart
Start by creating a new report server project (called ChartProject, or similar) and add a shared data source that points to your ReportingDemo database. Add a new report called MyChart.rdl to the project. Set up a data set for the report using the following query, which fetches various bits of information pertaining to customer purchases:SELECT Purchase.PurchaseID, Purchase.CustomerID, Purchase.PurchaseDate, Purchase.PurchaseType, Purchase.PurchaseAmount, Customer.FirstName + ' ' + Customer.LastName AS CustomerName FROM Purchase INNER JOIN Customer ON Purchase.CustomerID = Customer.CustomerIDOn your new report, drag the open content area out so that we have room to work and then drag a chart control onto the content area. It should look like this:


Chart types
Before we delve deeper into the chart control, it's worth noting that this control can produce a variety of the different chart types. Simply right-click on the chart (in the Layout tab) and use the Chart Type option to select a new chart type. For the time being, switch to a Smooth Line chart.Add a series
The Data fields and the Category fields make up the horizontal and vertical settings on the chart. The chart control can also layer multiple sets of data onto the same chart. Each layer is called a series. In this case the purchase data we are looking at pertains to two different customers. Drag the CustomerName field into the area to the right of the grid called Drop series fields here. Switch to the Preview tab and view the report, which displays each customer's spending patterns over the various dates:
Setting report properties
Before we get started, change the chart type back to Simple Bar. Then, right-click on the chart again and select Properties. Here you can set all of the properties of the grid and you can also control nearly every aspect of how your data is displayed. Note that you can also manually set up Data, Categories and Series data, which we did via drag and drop previously. We are going to look at each tab of the Properties dialog.Please notice that as we look through the various options, you will see the 'fx' button nearly everywhere. This is used to set a property value with an expression rather than with a hard-coded value, as described in Part 2.
General tab

Data tab

Now we are going to take a closer look at the Values properties in the Data tab. Click the Edit button next to the Values field. The dialog will open to the Edit Chart Value tab. On this tab you can set the field from the dataset the values of which will be displayed on the chart, and you can also give the series a name. The Appearance tab allows you to set point markers on your chart and control the style for the series. The Point Labels give you the ability to set a data field or other expression to label the points on your grid. The Action tab turns values into a hyperlink. You can jump to different places in the report or indeed to any valid URL. The URL can be hard-coded or set with an expression.
Let's open up the Point Labels tab so that we can display the values of the purchases being charted right on the bars in the chart. Set the Data Label to the expression =Fields!PurchaseAmount.Value and set the Format Code to C for currency. This will display the purchase amount directly on the grid bars in the $X.00 format. You can use the Label Style to manipulate the font and the color of the label.
X and Y axis tabs

Legend tab

3D effect tab

I love this tab! I could play around with these settings for hours. For the most part the default settings for each chart type look great. The four values that control the 3-D aspects of the chart are Horizontal Rotation, Perspective, Wall Thickness and Vertical Rotation. While it is fun to work with these to see what you can do, I suggest that you start with the defaults and use the slider for each value to see if you make the values on the chart readable. They work particularly well when you are working with a multi-layered 3-D chart like the one in this example.
For this example set the following values:
|
Horizontal Rotation |
65º |
|
Perspective |
0% |
|
Wall Thickness |
5% |
|
Vertical Rotation |
-5º |
After you've had a chance to preview these settings, come back and play with the various settings. Believe me, you can make some incredible looking charts with the 3D settings.
Filter tab

Let’s display two charts in our report. One will report on Internet Sales and the other on In Store Sales. First copy the chart and paste the copy below the existing chart.
For the top chart, open the properties tab and on the General tab set the Title to 'Internet Sales'. Now go to the Filters tab and set the filter:
|
Expression |
Operator |
Value |
|
=Fields!PurchaseType.Value |
= |
Internet |
For the bottom chart, open the properties tab and on the General tab set the Title to 'In Store Sales'. Now go to the Filters tab and set the filter:
|
Expression |
Operator |
Value |
|
=Fields!PurchaseType.Value |
= |
In Store |
The Report
Navigate to the Preview tab and let's take a look at the final reports. As you can see, we create a report with two 3-D Charts displaying subsets of data from a single dataset. While the data for this article was kept necessarily simple to allow us to focus on the chart control itself, imagine what you can accomplish in your own reporting system.
Wrap up
I hope this article has given you some insight into the chart control. Between the control's rich features and SSRS's ability to set nearly every property with an expression, you can now see that Microsoft has delivered an extremely powerful and user-friendly charting component in their reporting tool.
Beginning SQL Server Reporting Services Part 4:
This is the last installment of a four part article on SQL Server Reporting
Services:- Part 1, provided a step-by-step guide to basic report creation and
- Part 2 took a tour of some of the core SSRS features and functions that you'll need to develop dynamic reports
- Part 3 focused entirely on the built-in SSRS chart control
Here, in part 4, we focus on Report Definition Language
(RDL). The definition of RDL provided by MSDN2 is
succinct and hard to better, so I'll use it here:
"A report definition contains data retrieval and layout information
for a report. Report Definition Language (RDL) is an XML representation of this
report definition."We'll examine the component parts of a typical RDL file and discuss how knowledge of RDL will enable you to refine and customize your reports. We'll then take a look at Report Builder Tool, the new ad-hoc reporting tool that ships with SQL Server Reporting Services 2005. As a report developer, it allows you to create a report-building tool that then allows end-users to build custom reports based on the report definitions you've provided. Confused? Fear not, all will become clear.
In order to follow my examples, you will need to have SQL Server 2005, SQL Server 2005 Reporting Services, and Visual Studio 2005 correctly installed and configured. If you need some help with this, please refer back to the links in Part 1 of this series. Next, download the code file for this article (see the Code Download link above). The code file contains a sample Visual Studio project and a SQL Script for creating the ReportDemo database. If you've not done so already, go ahead and create the database using the ReportingDemoDatabaseScript.sql script or, alternatively, by restoring the provided ReportingDemo.bak file.
Now start a new Business Intelligence project in Visual Studio 2005 (or using BIDS, which installs with SQL Server 2005). Select Project | Add Existing Item to add to the project the shared datasource (ReportDb.rds) and the sample report definition file, FirstReportMan.rdl
Report Definition Language
Report Definition Language (RDL) is an XML-based schema for defining reports, and the reports that SSRS 2005 generates from the Visual Studio 2005 report designer are basically just XML. Each report has a header, footer and body. The schema defines:- Report layout– the body of the RDL file defines all of the objects that will be displayed in the report, including fields, images and tables
- Each dataset, the data source for each dataset and database connection information (where no data source is used)
- A set of fields in each dataset that can be populated with data
- Any parameters that are used in the report
http://www.microsoft.com/sql/technologies/reporting/rdlspec.mspx
Dissecting a typical RDL file
The easiest way to get familiar with the basics of RDL is to dive right in and take a look at the component part of a typical RDL file.Let's take a look the RDL for the FirstReportMan.rdl included in the download project. Open Visual Studio and open the sample project FirstReportMan.rdl. In the solution explorer, right-click on the FirstReportMan.rdl and select the View Code option. This opens the report in XML mode. The full XML for this file can be found in the code download bundle, but we'll just step through the major sections here.
Document element
Let's first take a look at the document element:
<?xml version="1.0" encoding="utf-8"?>
<Report xmlns="http://schemas.microsoft.com/sqlserver/reporting/
2005/01/reportdefinition"
xmlns:rd="http://schemas.microsoft.com/SQLServer/
reporting/reportdesigner">
The document element is called Report – no surprise there. It
references two XML namespaces:<Report xmlns="http://schemas.microsoft.com/sqlserver/reporting/
2005/01/reportdefinition"
xmlns:rd="http://schemas.microsoft.com/SQLServer/
reporting/reportdesigner">
- http://schemas.microsoft.com/sqlserver/reporting/2005/01/reportdefinition
- http://schemas.microsoft.com/SQLServer/reporting/reportdesigner
DataSources
The first element of the RDL file, below the namepsace reference is DataSources. In this element you can define a data source, or multiple DataSources, for your reports:
<DataSources>
<DataSource Name="ReportsDB">
<DataSourceReference>ReportsDB</DataSourceReference>
<rd:DataSourceID>b75a1ec2-03ed-4562-921e-28ca4150b215</rd:DataSourceID>
</DataSource>
</DataSources>
As you can see, this DataSource tag references our shared data
source, ReportsDB, and it also references a GUID for the data source. If
you weren't using a shared data source the schema looks like this:<DataSource Name="ReportsDB">
<DataSourceReference>ReportsDB</DataSourceReference>
<rd:DataSourceID>b75a1ec2-03ed-4562-921e-28ca4150b215</rd:DataSourceID>
</DataSource>
</DataSources>
<DataSource Name="ReportingDemo">
<rd:DataSourceID>f34d206b-ca72-4ca6-9d5c-4151cd7eadc3</rd:DataSourceID>
<ConnectionProperties>
<DataProvider>SQL</DataProvider>
<ConnectString>Data Source=SKYNET05\SKYNETSQL2005;Initial z
Catalog=ReportingDemo</ConnectString>
</ConnectionProperties>
</DataSource>
<rd:DataSourceID>f34d206b-ca72-4ca6-9d5c-4151cd7eadc3</rd:DataSourceID>
<ConnectionProperties>
<DataProvider>SQL</DataProvider>
<ConnectString>Data Source=SKYNET05\SKYNETSQL2005;Initial z
Catalog=ReportingDemo</ConnectString>
</ConnectionProperties>
</DataSource>
Margins
Oddly enough, the margins for the report are defined next. Remember this is XML; the tag order doesn't really matter and it will vary from report to report. You will find the other tags, such as the report GUID, scattered around reports:
<BottomMargin>1in</BottomMargin>
<RightMargin>1in</RightMargin>
<rd:ReportID>b3751a5a-3ac4-4b97-bdc2-cea456baad26</rd:ReportID>
<LeftMargin>1in</LeftMargin>
<Width>5.625in</Width>
<InteractiveHeight>11in</InteractiveHeight>
<Language>en-US</Language>
<TopMargin>1in</TopMargin>
<RightMargin>1in</RightMargin>
<rd:ReportID>b3751a5a-3ac4-4b97-bdc2-cea456baad26</rd:ReportID>
<LeftMargin>1in</LeftMargin>
<Width>5.625in</Width>
<InteractiveHeight>11in</InteractiveHeight>
<Language>en-US</Language>
<TopMargin>1in</TopMargin>
Report parameters
ReportParameters is the next major section. Each report parameter has a name, a data type and a label, which is used when the user is prompted to enter a value. Each parameter can also have a ValidValues section, which defines the list of valid values that will be used to populate the dropdown parameter list that is displayed to the user when they are prompted for a parameter value:
<ReportParameters>
<ReportParameter Name="ReportTitle">
<DataType>String</DataType>
<AllowBlank>true</AllowBlank>
<Prompt>Report Title</Prompt>
<ValidValues>
<ParameterValues>
<ParameterValue>
<Value>My First Report</Value>
<Label>Title1</Label>
</ParameterValue>
<ParameterValue>
<Value>Customer Report</Value>
<Label>Title2</Label>
</ParameterValue>
</ParameterValues>
</ValidValues>
</ReportParameter>
<ReportParameter Name="ReportingUserID">
<DataType>String</DataType>
<Prompt>ReportingUserID</Prompt>
</ReportParameter>
</ReportParameters>
In this RDL file, we have two parameters, ReportTitle and ReportUserID.
The ReportTitle parameter is a string parameter and has two valid
values, MyFirstReport and CustomerReport, which correspond to the labels, Title1
and Title2, respectively. If the users selects Title1 from the dropdown,
then the report title is displayed as MyFirstReport, and so on. The ReportUserID
is also a string, and has no valid values defined for it.<ReportParameter Name="ReportTitle">
<DataType>String</DataType>
<AllowBlank>true</AllowBlank>
<Prompt>Report Title</Prompt>
<ValidValues>
<ParameterValues>
<ParameterValue>
<Value>My First Report</Value>
<Label>Title1</Label>
</ParameterValue>
<ParameterValue>
<Value>Customer Report</Value>
<Label>Title2</Label>
</ParameterValue>
</ParameterValues>
</ValidValues>
</ReportParameter>
<ReportParameter Name="ReportingUserID">
<DataType>String</DataType>
<Prompt>ReportingUserID</Prompt>
</ReportParameter>
</ReportParameters>
Body
The report Body section is next. It has two main tags under it: Height and ReportItems.
<Body>
<ReportItems>
…
</ReportItems>
<Height>0.875in</Height>
</Body>
The height property simply defines the height of the body area. It is the ReportItems
elements that is the true star here. All of the objects displayed in the report
are contained in this section of the RDL file. If you examine this carefully,
you will see that there is a table definition and two textbox definitions under
ReportItems. Each specifies its height and width, z-order, and top and
left positioning. Inside the table you will find separate definitions for:<ReportItems>
…
</ReportItems>
<Height>0.875in</Height>
</Body>
Let's start wih the definiton of our table, MyFirstTable. In the Details section of the table definition, we define each detail row of the table, which in this case are populated with values for FirstName, LastName, State, Date of Birth and Status. If the data were grouped or sorted in any way, this would be defined in this section, using the <grouping> and <sorting> elements respectively. Here we show only the FirstName cell:
<Table Name="MyFirstTable">
<DataSetName>ReportData</DataSetName>
<Top>0.375in</Top>
<ZIndex>2</ZIndex>
<Details>
<TableRows>
<TableRow>
<TableCells>
<TableCell>
<ReportItems>
<Textbox Name="FirstName_1">
<rd:DefaultName>FirstName_1</rd:DefaultName>
<ZIndex>4</ZIndex>
<Style>
<PaddingLeft>2pt</PaddingLeft>
<PaddingBottom>2pt</PaddingBottom>
<PaddingRight>2pt</PaddingRight>
<PaddingTop>2pt</PaddingTop>
</Style>
<CanGrow>true</CanGrow>
<Value>=Fields!FirstName.Value</Value>
</Textbox>
</ReportItems>
</TableCell>
We then move on to the Header area of the table. Here we define each
cell of this table Header. These correspond to the column headings of our
table. For example:<DataSetName>ReportData</DataSetName>
<Top>0.375in</Top>
<ZIndex>2</ZIndex>
<Details>
<TableRows>
<TableRow>
<TableCells>
<TableCell>
<ReportItems>
<Textbox Name="FirstName_1">
<rd:DefaultName>FirstName_1</rd:DefaultName>
<ZIndex>4</ZIndex>
<Style>
<PaddingLeft>2pt</PaddingLeft>
<PaddingBottom>2pt</PaddingBottom>
<PaddingRight>2pt</PaddingRight>
<PaddingTop>2pt</PaddingTop>
</Style>
<CanGrow>true</CanGrow>
<Value>=Fields!FirstName.Value</Value>
</Textbox>
</ReportItems>
</TableCell>
<TableCell>
<ReportItems>
<Textbox Name="FirstName">
<rd:DefaultName>FirstName</rd:DefaultName>
<ZIndex>9</ZIndex>
<Style>
<PaddingLeft>2pt</PaddingLeft>
<PaddingBottom>2pt</PaddingBottom>
<FontWeight>700</FontWeight>
<BackgroundColor>LightSeaGreen</BackgroundColor>
<Color>WhiteSmoke</Color>
<PaddingRight>2pt</PaddingRight>
<PaddingTop>2pt</PaddingTop>
</Style>
<CanGrow>true</CanGrow>
<Value>First Name</Value>
</Textbox>
</ReportItems>
</TableCell>
Finally, we have the TableColumn element, which defines the
appearance of each column in the table:<ReportItems>
<Textbox Name="FirstName">
<rd:DefaultName>FirstName</rd:DefaultName>
<ZIndex>9</ZIndex>
<Style>
<PaddingLeft>2pt</PaddingLeft>
<PaddingBottom>2pt</PaddingBottom>
<FontWeight>700</FontWeight>
<BackgroundColor>LightSeaGreen</BackgroundColor>
<Color>WhiteSmoke</Color>
<PaddingRight>2pt</PaddingRight>
<PaddingTop>2pt</PaddingTop>
</Style>
<CanGrow>true</CanGrow>
<Value>First Name</Value>
</Textbox>
</ReportItems>
</TableCell>
<TableColumn>
<Width>1.25in</Width>
</TableColumn>
<Width>1.25in</Width>
</TableColumn>
Page header
After the body, we come to the PageHeader. This section also has a ReportItems section to contain any display objects just as the body does. It also has tags for whether or not to display the header on the first and last page of the report. This is a useful feature if you have ever tried to have a report with a cover page in a tool that doesn't support this option.
<PageHeader>
<ReportItems>
<Textbox Name="ReportTitle">
<rd:DefaultName>ReportTitle</rd:DefaultName>
<Width>3.25in</Width>
<Style>
<PaddingLeft>2pt</PaddingLeft>
<PaddingBottom>2pt</PaddingBottom>
<FontWeight>700</FontWeight>
<FontSize>16pt</FontSize>
<PaddingRight>2pt</PaddingRight>
<PaddingTop>2pt</PaddingTop>
</Style>
<CanGrow>true</CanGrow>
<Value>=Parameters!ReportTitle.Value</Value>
</ReportItems>
<Height>0.375in</Height>
<PrintOnLastPage>true</PrintOnLastPage>
<PrintOnFirstPage>true</PrintOnFirstPage>
</PageHeader>
In our page header, we just have a single texbox, called ReportTtitle
DataSets
DataSets is the next section, with each DataSet element, predicatbly, describing a dataset that is used in the report. Each Dataset has a query definition with command type, command text, and reference to the datasource. The list of fields follows. Each field has a field name and data type. So, our ReportData dataset is described as folllows:
<DataSet Name="ReportData">
<Query>
<CommandType>StoredProcedure</CommandType>
<CommandText>spr_CustomerSelectAll</CommandText>
<DataSourceName>ReportsDB</DataSourceName>
</Query>
<Fields>
<Field Name="CustomerID">
<rd:TypeName>System.Int32</rd:TypeName>
<DataField>CustomerID</DataField>
</Field>
Last, but not least, is the code section. This section is simply the text of
the custom function we embedded in the report.<Query>
<CommandType>StoredProcedure</CommandType>
<CommandText>spr_CustomerSelectAll</CommandText>
<DataSourceName>ReportsDB</DataSourceName>
</Query>
<Fields>
<Field Name="CustomerID">
<rd:TypeName>System.Int32</rd:TypeName>
<DataField>CustomerID</DataField>
</Field>
<Code>Public Function GetColor(ByVal status as String) as
String
IF status = "100" Then
Return "White"
End IF
IF status = "101" Then
Return "Yellow"
End IF
IF status = "102" Then
Return "Tomato"
End IF
End Function
</Code>
IF status = "100" Then
Return "White"
End IF
IF status = "101" Then
Return "Yellow"
End IF
IF status = "102" Then
Return "Tomato"
End IF
End Function
</Code>
Writing your own RDL
Okay, so now you have a good idea of the RDL that is written behind the scenes when the SQL Report Designer is doing its thing. This understanding of the report designer gives you the ability to manually tweak a report when necessary. I've found that I have had to do this less in SQL Server 2005 than in the 2000 version. However, knowing RDL empowers you in other ways too. You are not restricted to using the Visual Studio Report designer, because SQL Reports are not in some proprietary format. If you wish, you can roll your own report builder tool or RDL generator.I recently built such a tool for a client. They wanted a reporting tool that could build and publish reports on the fly. Using SQL Report Designer, I created a base report that had the client's standard header and footer. The body was left blank – as was the report name. I saved the RDL to an XML file. When someone submitted a query on which to base a report, I opened the base XML in an XML Document Object. The tool parsed the SQL statement for the fields and created the ReportItems in the body. Next, the tool created the dataset information and then published the report to their reporting server. The rs.exe utility that ships with SSRS 2005 can be used to publish reports from your application or from the command line.
One important note on using the XML Document Object to build a report: I had to remove the report definition schema from Report tag before it would load into the XML Document object. Just before I saved it added it back in as an attribute.
Using the Report Builder
The Report Builder is a neat addition to the SSRS package. It allows developers to create a tool that is delivered to the user via the web, using one-click deployment. The tool allows the user to select from pre-defined fields and functions as the basis for building their own reports. The user can use the simple drag and drop interface to build custom reports. It's a great way to give limited control over reporting to your user base, without giving them too much authority on the database.Defining a report
In this exercise we are going create a report definition that will allow the end-users to customize their own reports. Start by creating a new project type called Report Model Project from the Business Intelligence options in Visual Studio 2005. Look in the Solution Explorer. You should have a project with three folders underneath it.- Data Sources
- Data Source Views
- Report Models.
Adding a Data Source
This works almost the same as it does in regular reporting services. When you add a new data source (Project -> Add New Item) you get a wizard. The wizard will automatically look for the data source on your local report server or which ever report server you configure the project to use. If you have not defined the correct data source, you can create a new data source object like we did previously.
Adding a Data Source View
Data Source Views allow you to define which tables the user has to select from when they are creating a report. It also allows you to define the relationships between those tables so that the report knows how to join them. Table relationships can be based on foreign keys or a name matching schema. If you choose some type of name matching option the report will attempt to join tables based on columns with the same name or based on primary keys.Select Project -> Add New Item from the menu and choose Data Source View. Click next to get past the first page of wizard. The first screen asks you to select a data source to use for this view.

As you can see, there is also the option of Create a new data source here as well. Select the data source you set up in the previous step.

On this screen you tell the report builder how you want 'name matching' to take place when it constructs the SQL statement. As you select the radio buttons the sample code changes in the bottom pane. For now let's go with the default option (same name as primary key). Click Next.

On this screen, you select which tables and/or views you want to include in the view. Select the Customer table and move it to the list box on the right-hand pane. Click Next.

The last screen of the wizard gives you a chance to name the Data Source View. Click Finish and you've created a data source view.
Adding a Report Model
The Report Model takes a Data Source View and wraps so that the end user can use the tables it contains. The Report Model also allows you to select which individual fields from those tables are available to the report.From the menu, select Project -> Add New Item. When the dialog opens, select Report Model Wizard and name it ReportingDemo.smdl. Alternatively, you can right-click on the Report Model folder and select Add New Data Model. Either way, click past the wizard start screen.

Select the Data Source View we just created and click Next. Note that you could create a data source view from this screen as well. Click Next.

In addition to simply providing you with fields you select, the report builder also gives you the option-adding aggregate functions. You can determine which functions you want to be added on this page: Report Model Generation Rules. For this particular demo, use the defaults and click Next.

The model statistics screen allows you to determine whether you want the database to update its statistics before the report builder is generated. This is generally a good idea. For now leave the defaults and click Next. On this last page you can give the report model a name. If you choose not to, one is supplied based on the data source view you chose for the report.

The only thing left to do is click the Run button. This generated the basis for the report. Once Run has completed, you can examine the options created. The Run button will change to the Finish button. Click the Finish button to complete the wizard.
Build and publish
Lastly, right-click on the project icon and build and publish this project to your report server. This may take a couple minutes the first time you do it. The report builder is actually compiling a windows application and setting it up for one-click deployment over the web.Using the Report Builder to make a report
When we run the report builder is launches a windows application that allows the user to drag and drop field on a canvas in order to create a report. The user gets to determine which fields are on the report in which order. They can format the report as they wish and run it.Let's run the report builder. Remember that everything from now on is meant to be experienced by the users. You must have the .NET Framework 2.0 redistributable installed on your machine before you can run this.
Navigate to your Reports website: http://localhost/Reports/.

Notice that in the tan bar there is a new option called Report Builder. Click on it to launch Report Builder. The first time you do this it has to download the code base, so it may take a few seconds to activate.

Once the Report Builder has opened, you will see a Getting Started panel on the right. Just under that there should be a list box showing the report models. If you have only defined a single report model you may not see this dialog. The report model you created will be used by default. The one you just created and deployed should be listed. Select it. Choose the Table Layout and click OK.

Now let's get our bearings. On the left you have the Entities list box which lists each table from the report model you selected. When a table or view is selected, all of the field options for that entity are listed beneath it.
The report designer takes up the rest of the screen. Click on the text box labeled Click to Add Title and give your report a title. Next, drag some fields into the table. I added the customers' First Name, Last Name, City, State and Birth Year. The birth year is available under functions if you expand Date of Birth Just drop each field to the right (or left) of the previous one. The tool will automatically add columns for you.

Click the Run Report button at the top of the page.

This is the result. Notice that by clicking on the column headers you can sort the report. You can toggle back to Design View with the button next to Run Report, but let's stay here for now. Now click on the Filter button. The Filter dialog appears.

Double click on State. State equals appears in the right pane. A dropdown menu provides you with a unique set of values from the result set. Select CA. and Click OK. The report regenerates, and only your California customers are displayed on the report.

So there you have it. Report Builder allows you to deliver an Ad-hoc reporting tool to you clients. If you find yourself constantly having to produce custom reports for various clients, all off the same data, then this is the tool for you. It allows you to transfer that control to your customer's hands. That frees you up to do more important work and your customers may even enjoy designing their own reports. For your part you free up your time and look like a hero to your customers and your boss.
Conclusion
I hope this tutorial article has given you some insight into the capabilities of SQL Server Reporting Services 2005. There are many more features for you to discover. Just to name a few, I suggest you look into sub-reports, the charting control, report caching and report subscriptions. Happy reporting…
Ten Common SQL Server Reporting Services Challenges and
Solutions:
Many of us who have to develop a Reporting Services
(SSRS) application come across various problems, hurdles or
'gotchas' that cause much head-scratching. We've never seen, elsewhere,
the ten most common SSRS problems ever listed, let alone their solution, but
then along came Ryan with both. Help is now at hand for anyone wrestling
with Reporting Services. Indispensable reading for any SSRS beginner.
In every business there are several different groups of report
users, from chief executives, to business analysts, to operational staff, who
all need access to reliable and current data in order to track overall business
performance, investigate the effectiveness of individual business functions, or
simply for ad-hoc day-to-day reporting.
In most organizations, at least some attempt has been made to meet these
reporting needs. Historically, however, the problem has been that the available
reports have not always been up-to-date, or even accurate. Furthermore,
individual departments have tended to adopt a "silo" approach, using
different tools/systems to create reports that are useful within their silo,
but not necessarily consistent or compatible with those produced by other
departments. In many cases, there doesn't even exist a shared understanding of
the business data that underpin these reports.SQL Server Reporting Services (SSRS), when it arrived, offered a much-needed means to centralize and standardize reporting across the business, and it has largely delivered. Having used SSRS 2005 for the past 4 years, I've found that, with a little effort, it can satisfy most business, ad-hoc, embedded, portal integration, web, and custom reporting needs. However, I've also found that small "gotchas" can halt progress and cause considerable frustration, as it's not always easy to find ways round them in the documentation.
In this article, I round up some of the more interesting challenges that I have encountered in my report development efforts, and the solutions I've found to them. Hopefully, these will be useful to the many (the majority?) people who are still using SSRS 2005 in production. Some of the solutions offered can still be used in SSRS 2008. I conclude the article with a review of some of the issues that SSRS 2008 has fixed, or at least mitigated.
Challenges/Solutions
SSRS offers a range of different reporting techniques and technologies, to cater for the reporting needs of all levels of users, from the chief executives, to business analysts, to operational staff. Their reporting needs range from simple, tabular ad-hoc reports, to parameterized, linked or snapshot reports, to complex drill-down and drill-through multi-level reports.Following is the list of some of the challenges I have encountered while developing such reports using Reporting Services 2000/2005. In the sections that follow, I will cover each challenge individually, providing insight into what may cause the difficulty, alongside a possible solution.
- Horizontal Tables: Calendar Reports
- Select "ALL" Query Parameter option
- Multiple Sheets in Excel
- Excel Merged Cell Issues
- Blank Pages
- Vertical Text
- Report Data in Header/Footer
- Are you missing XML/CSV data on your exports?
- Template Reports
- Using the Reporting Services database
Horizontal Tables: Calendar Reports
The most common need for horizontal display of information, in my experience, is for labeling or for calendar-style reports. There is no native control that allows you to display your data horizontally. There are a few different ways around this, but the easiest way I've found is to use a Matrix control, which allows display of data in a cross-tab or pivot format.The sample I will be using is of a calendar style report, which will display a report of events which occur in the timeframe displayed. You can build the report from scratch using the steps that I'll outline next, or you can simply import the completed Calendar.rdl file, as part of sample project proved in the code download for this article.
The driving query for this report is shown in Listing 1. The opening lines calculate the required date range for the current month, which may include dates from the prior and forthcoming months, in order to ensure that the results display appropriately on the calendar. The StartDate parameter defines the first Sunday, and the EndDate parameter the last Saturday, to display on the calendar.
The code then creates two Common Table Expressions (CTEs), new to SQL Server 2005 and later. The first, Dates, generates a record for every day in the required date range and the second, Events, simply creates some sample event records for display in the calendar.
Finally, we query these two CTEs, using a ranking function, DENSE_RANK, to assign number to the records based on the date, and various date functions to generate the columns for the matrix control (days of the week), days of the month, event details and so on. The query in Listing 1 is self contained, so all you need to do to test it out is point it to a SQL Server 2005 data source.
DECLARE @StartDate DATETIME, @EndDate DATETIME
--First day of current month
SET @StartDate = DATEADD(s,0,DATEADD(mm, DATEDIFF(m,0,GETDATE()),0))
--First day to display on calendar
SET @StartDate = DATEADD(DAY,-DATEPART(WEEKDAY,@StartDate)+1,@StartDate)
--Last day of month
SET @EndDate = DATEADD(s,-1,DATEADD(mm, DATEDIFF(m,0,GETDATE())+1,0))
--Last day to display on calendar
SET @EndDate = DATEADD(DAY,6-DATEPART(WEEKDAY,@EndDate),@EndDate)
; WITH Dates([Date]) AS (
--Select First day in
range
SELECT CONVERT(DATETIME,@StartDate) AS [Date]
UNION ALL
--Add a record for every
day in the range
SELECT DATEADD(DAY, 1, [Date]) FROM Dates WHERE Date
< CONVERT(DATETIME,@EndDate)
), Events AS (
--Create some events to
place on the calendar
SELECT EventDate = CONVERT(VARCHAR(2),DATEADD(MONTH, -1,GETDATE()),101) + '/30/2009 02:00:00 PM',
Note = 'Event 1'
UNION SELECT EventDate = CONVERT(VARCHAR(2),GETDATE(),101) + '/23/2009 12:00:00 PM', Note = 'Event 2'
UNION SELECT EventDate = CONVERT(VARCHAR(2),GETDATE(),101) + '/28/2009 02:00:00 PM', Note = 'Event 3'
UNION SELECT EventDate = CONVERT(VARCHAR(2),GETDATE(),101) + '/28/2009 06:30:00 PM', Note = 'Event 4'
UNION SELECT EventDate = CONVERT(VARCHAR(2),GETDATE(),101) + '/30/2009 07:00:00 PM', Note = 'Event 5'
UNION SELECT EventDate = CONVERT(VARCHAR(2),DATEADD(MONTH, 1,GETDATE()),101) + '/01/2009 01:30:00 PM',
Note = 'Event 6'
) SELECT
-- Number the records
based on the date, if multiple records have
-- the same date then they will be numbered the same. Used in
-- calculation to determine row record is to display on.
-- the same date then they will be numbered the same. Used in
-- calculation to determine row record is to display on.
[Order] = DENSE_RANK() OVER (ORDER BY d.[Date]),
-- date used in all
caluclation for date
d.[Date],
--generates matrix columns
[WeekDay] = DATEPART(WEEKDAY, d.[Date]),
--used to display day of month on
calendar
[Day] = DATEPART(DAY,d.[Date]),
--used in some
calculations for display
[Month] = DATEPART(MONTH,d.[Date]),
-- used to get the time of the event
e.EventDate,
--event details to
display
e.Note
--CTEs defined above are used as the queries for the
results
FROM Dates d
LEFT JOIN Events e ON CAST(CONVERT(VARCHAR(10),e.EventDate,101) AS DATETIME) = d.[Date]
--Set the maximum times the Dates cte can recurse
OPTION (MAXRECURSION 100)
Listing 1: The Calendar Report Query
Having defined the query, you can build the report. Start with a blank report and add the query as a dsCalendar data set, as shown in Figure 1.
Figure 1: Defining the Calendar report data set
Having created the data set, add a Matrix control to the report, as shown in
Figure 2.
Figure 2: Adding the matrix control
Figure 2 displays three watermarked areas of the control:- Columns - the matrix column header, which we can use to group the column data.
- Rows the matrix row grouping for row data, which we can use to group the row data.
- Data – this cell holds the detail data for the report.

Figure 3: Adding a table control to the matrix
The next step is to associate the Matrix control with our dsCalendar
data set, as shown in Figure 4.
Figure 4: Associating the matrix control with our data set
Next, I need to establish the row and column grouping for our matrix
control. To set the row grouping, switch to the Groups tab on the Matrix
properties dialog, select the default row grouping item in the list matrix1_rowGroup1
and click the Edit button. Set the value of the "Group on" Expression to =Ceiling(Fields!Order.Value / 7), as shown in Figure 5. This Ceiling expression is used to determine when a row should break for the next week, which for the most part will be every 7 records.

Figure 5: Grouping the matrix rows
Click OK, and then select the default column grouping item in the list matrix1_ColumnGroup1
and click the Edit button. This time, for the "Group on"
Expression, simply select =Fields!WeekDay.Value for the drop down list
and click OK, as shown in Figure 6.
Figure 6: Grouping the matrix columns
The table inside the "Data" region of the Matrix doesn't require
any further work. Based on the established matrix row and column groupings, the
matrix data will be organized appropriately.Now that the control of the data is set up, it's time to define the expressions that will determine what data to display in the matrix and table, when the report is rendered.
First, however, I am going to resize the control. We don't need to display anything in the matrix "rows" region, so we minimize the left column of the matrix control, as shown in Figure 7.

Figure 7: Resizing the matrix columns
The next step is to apply the following Expressions to the various report
items for display on the report:- Matrix Column Header: =WeekdayName(Fields!WeekDay.Value)
- Displays the days of the week across the top of the report
- Table Column Header: =Fields!Day.Value
- Displays the day for each day in the timeframe
- Table
Detail Column 1: =IIf(Fields!Note.Value
= Nothing, "", CDate(Fields!EventDate.Value)
.ToShortTimeString + ":") - Displays the time of the event in the first column of the table
- Table Detail Column 2: =Fields!Note.Value
- Displays the event details in the second column of the table
Figure 8 shows the Matrix populated with these expressions.

Figure 8: Matrix expressions
When the report is rendered, it will look similar to that shown in Figure 9.
Figure 9: Rendering the Calendar report
Although the report is now functional, it still looks a little unpolished,
so the final step is to tweak the layout and formatting until you are happy
with it. Figure 10 shows the finalized report, both in layout mode and
rendered.

Figure 10: The finalized Calendar report
Select "ALL" Query Parameter option
When using a query to populate an options list for a parameter, sometimes there is a need to select several options at once, rather than an individual option from the provided list. For example, you may want to run a report for multiple companies, instead of each one individually.In order to do this, you just need to add a UNION clause to the query that is used to populate a drop down of available options for the company parameter. So, for example, if the original query to populate the parameter list might be of the following form:
SELECT CompanyId,
CompanyName FROM Company
When rendered, the parameter dropdown list for the report would look as
shown in Figure 11.
Figure 11: Selecting individual parameter values
The updated query, allowing users to select all the available parameter
values, might look as follows:
SELECT NULL AS CompanyId, 'ALL' AS CompanyName
UNION
SELECT CompanyId, CompanyName FROM Company

Figure 12: Selecting all parameter values
Next, in the data set that uses the value returned from the query parameter,
you will need to update your WHERE clause to work appropriately with the
updated parameter. For example, if the original WHERE clause looks as
follows:WHERE CompanyId = @Company
The updated WHERE clause will be:
WHERE (@Company
IS NULL OR CompanyId = @Company)
Now, as well as being able to filter the data by an individual company, you
can cancel the filter by selecting ALL, which sets the @company
parameter to NULL and return results from the query as if there was no
company filter.Multiple Sheets in Excel
Have you had a need to create multiple sheets in Excel? To render a report to Excel on multiple sheets, be sure to use page breaks after the different sections of the report. If a section doesn't specifically allow page breaks, then you'll need to wrap the controls inside a rectangle and set the page break property on the rectangle.Let's say you have a report with two table regions, as shown in Figure 13.

Figure 13: A report with multiple table regions
When you export the report to Excel, you'll find that both the table regions
display on the same worksheet, as shown in Figure 14. This makes it hard to
make modifications to the Excel file.
Figure 14: Two table regions rendered to the same Excel
worksheet
To make the table regions display on different worksheets, you can set the PageBreakAtEnd
property to True, as shown in Figure 15.
Figure 15: Setting the PageBreakAtEnd property
When the report is exported to Excel, two worksheets will now be created, as
shown in Figure 16.
Figure 16: Two table regions exported to two worksheets
In case you are wondering how to rename the sheets when the report is
exported to Excel, there isn't a built-in way. You have the option to design a
custom rendering extension, buy 3rd party if one supports this, or
to modify the excel file post-export.A more advanced example of this technique is demonstrated in the Report Index.rdl file, as part of the code download.
Excel Merged Cell Issues
Excel can sometimes seem like the worst rendering extension available in reporting services. If you export a report to Excel, and then try to re-sort the exported data, you get a merged cell error. So, unless you completely reformat the export post-export, you cannot resort your columns.Reporting Services renders everything top down, and there are several ways in which the merged cell problem can occur when you export the report to Excel:
- If you have anything (controls, images, etc.) laid out above your table/matrix regions
- If you merge cells in your table/matrix regions
- If controls from the top of the report do not lineup with controls from your table
Figure 17 shows an example of a page header containing an image control and a textbox control, which will cause merged cell issues when exported to Excel. Notice that there are gaps between the controls. Each gap, and each control, that does not span the width of the designer will cause a separate column to be created when you export it to Excel.

Figure 17: A page header that will cause merged cell issues
Figure 18 shows the same page header, formatted in a way that will not cause
the problem. Notice how the control spans the width of the designer.
Figure 18: A page header that won't cause merged cell issues
What I've done is remove the image control and set a background image for
the textbox control. I also added some padding to the textbox control to change
the position in which the text will display, so that the image will display
left of the text. This will resolve the merged cell issue, caused by having gaps
and multiple controls in the page header.There is also some Device Information Settings that can be used to alleviate some of these merged cell issues. For instance, on export you can set the setting for SimplePageHeaders to True. More details about this setting can be found here:
http://msdn.microsoft.com/en-us/library/ms155069(SQL.90).aspx.
Blank Pages
Are blank pages a problem for you, when you export/print your reports? In most cases the extra blank pages result from the fact that the body of your report is too wide.Let's say you want your report printouts to fit on 8.5in x 11in paper, with 0.5in margins on all sides. This means that the maximum width of your report body in the designer can be 7.5in. If it exceeds that value, then you will get the extra pages printed. Most report developers fall into this trap by having their design surface laid out wider than the allowed width of the body of the report, which would be 7.5in, in this example. As you can see in Figure 19, I ensure that my report body is consistent with a portrait layout of a report. My margins are setup as 0.5in on all sides and the report width is set to 8.5in. So when I layout my report I do not want my designer to exceed 7.5in in width to stay within the report margins and report width.

Figure 19: Report Properties and Layout
Another reason blank pages could be created when you export your report is
if you allow your controls to grow. If you do, then they can sometimes grow
past the maximum page width for your report. You can prevent your controls from
growing by setting the following properties of a control from either the
properties dialog or properties panel, as seen in Figure 20. Set the "Textbox
height" options in the properties dialog, or set the CanGrow properties
in the properties panel of Visual Studio.
Figure 20: CanGrow Properties
Vertical Text
Have you ever needed to display your report information vertically, either top-to-bottom or bottom-to-top, rather than left- to-right? There is some support for this in reporting services. For example, you can set the WritingMode property of your textbox to tb-rl, as shown in Figure 21.
Figure 21: Setting the WritingMode property of a text box
As a result, the information in the textbox will display top-to-bottom, as
shown in Figure 22.

Figure 22: Top-to-bottom vertical text
Displaying your text bottom-to-top is a little trickier; you need to create
an image and either set the background image of the control to the generated
image, or use an image control. Let's take a look at an example. Again, you can
either work through the following steps, or download the completed report, VerticalText.rdl.What is required is a function, shown in listing 2, that will take the text passed in, measure it, and generate an image of appropriate size with the text displayed bottom-to-top.
Shared Function LoadImage(ByVal text As String) As Byte()
Dim bmp As New System.Drawing.Bitmap(1, 1)
Dim graphic As System.Drawing.Graphics = System.Drawing.Graphics.FromImage(bmp)
Dim font As New System.Drawing.Font("Arial",
10)
Dim width As Integer = graphic.MeasureString(text, font).Width
Dim height As Integer = graphic.MeasureString(text, font).Height
bmp = New System.Drawing.Bitmap(height, width)
graphic = System.Drawing.Graphics.FromImage(bmp)
graphic.Clear(System.Drawing.Color.White)
graphic.TextRenderingHint
= System.Drawing.Text.TextRenderingHint.AntiAlias
graphic.TranslateTransform(0, width)
graphic.RotateTransform(270)
graphic.DrawString(text, font, New System.Drawing.SolidBrush(System.Drawing.Color.Black), 0, 0)
graphic.Flush()
Dim ms As New IO.MemoryStream
bmp.Save(ms, System.Drawing.Imaging.ImageFormat.Jpeg)
Return ms.ToArray()
End Function
Listing 2: The LoadImage FunctionOn the menu bar in Visual Studio, select Report | Report Properties and then paste the above code into the "Code" tab, as shown in Figure 23.

Figure 23: The LoadImage function for displaying vertical
text
Next, you will need to add a reference to the System.Drawing
namespace, in order to access the basic graphics functionality. Click the
"References tab" of the dialog and then the browse ("..")
button. Locate the System.Drawing assembly and click
"Add". The reference will be added, as shown Figure 24.
Figure 24: Adding a reference to Systme.Drawing
Add an image control to the design surface, and then set the MIMEType property to image/jpeg,
the Source property to Database,
and the Value property to =Code.LoadImage("Hello
World"), as shown in Figure 25. Notice that the value
property uses the LoadImage function in our embedded
code.
Figure 25: Setting the image control properties
When rendered, the report looks as shown in Figure 26.

Figure 26: The rendered report, with top-to-bottom and
bottom-to-top vertical text
Natively, SSRS does not allow for text to be displayed at an angle except
for in some charts. If you can figure out how to modify the code for the LoadImage function so that it displays the text at an angle
and generates an image, you would have a solution for the issue of angled text
as well!Report Data in Header/Footer
Reporting Services does not provide out of-the-box support for use of information from your queries in Page Headers and Footers. There are two ways around this.The first way is to create controls in the body of your report, holding the values you need to display in the header and/or footer. You can set these controls to "hidden", and place them in some out-of-the-way place, towards the bottom of the report. Then, you can set expressions on controls in your header and footer sections to the value of the control in the body of your report.
In the following example, shown in Figure 27, I placed a textbox control in the body of the report named "textbox1", with a value of "Hello World". In the header section, I placed a textbox with a value of "=ReportItems!textbox1.Value". I then copied the control in the header section and pasted it into the footer section.

Figure 27: Display report data in headers and footers, using
a hidden control in the body
If you preview this report, the value of "textbox1" will be
displayed in the header and footer, as shown in Figure 28.
Figure 28: Three times Hello World
A slightly cleaner option, in my opinion, is to create a public function
that can be called to set the value of a variable, which can then be used in
any or all sections of the report body, header, and footer. Figure 29 shows the
embedded code that creates this SetReportTitle function, containing the _Title
variable. 
Figure 29: The SetReportTitle function.
In this example, you can then simply set the value of the hidden textbox in
the body of your report to "=Code.SetReportTitle("Report
Title")". This calls our function and sets the value of the _Title
variable to Report Title. Now, you can set the value of any control in the header or footer to "=Code._Title". The variable can be used in any or all sections of the report body, header, and footer.
Missing Data in CSV/XML Exports
Is some of your data not getting exported to the data export formats of CSV or XML? Reporting Services, by default, has all data controls set to auto-output on export. This means that the rendering extension whether CSV or XML determines what gets exported. When exporting to the data specific rendering extensions, the extension determines what to export, which in most cases means that tabular data gets exported but not data determined to be informational. There is a way around this feature.When you click on a control that contains data that you want to export, you should set the property DataElementOutput to "Output", as shown in Figure 30.

Figure 30: Setting the DataElementOutput property in
preparation for export to CSV or XML.
Alternatively, you can also set this option by right-clicking the control
and selecting properties. Once the properties dialog is displayed go to the
"Data Output" tab and select the "Yes" option under the
"Output" section, as show in Figure 31.
Figure 31: Setting the DataElementOutput property from the
Data Output tab
By setting this property to "output", it ensures that your
information will get exported. These Data Output options are used only by the
CSV and XML rendering extensions. All other built-in formats are exported based
on layout and don't use the Data Output settings.Template Reports
Do you use a predefined layout when you start work on a new report? Do you want to be able to add your report templates to Visual Studio through the "Add New Item" feature? Well, as luck would have it, it's pretty easy to override the built-in template, or add your own templates.In order to do this, simply navigate to Visual Studio's ReportProject directory, in Windows Explorer:
C:\Program Files\Microsoft Visual Studio
8\Common7\IDE\PrivateAssemblies\ProjectItems\ReportProject
Note that this path should be accessible if you are using a default
installation of Visual Studio. If not, then you'll need to amend the path as
appropriate. This ReportProject folder is the one in which VS stores the Report.rdl file that is used as the default template when you add a new report to your project, as shown in Figure 32.

Figure 32: The default Report.rdl file is stored in the
ReportProject folder.
You can replace this default Report.rdl file with your own template,
or simply add your own templates to the same folder. In this example, I've
added a landscape and a portrait template to the directory as shown in Figure
33.
Figure 33: Adding custom templates
Now, when I choose to add a new item in Visual Studio, my report
"templates" are available to be selected, as shown in Figure 34.
Figure 34: The Portrait and Landscape template are available
when creating new reports
Note that the "My Templates" area you see in Figure 34 uses a
specialized zip structure with some special code to setup how the template is
to be used. My report templates are simply "base layouts" for
Portrait and Landscape reports that I use to keep things standard. You can
obtain the two example templates, PortraitTemplate.rdl and LandscapeTemplate.rdl, form the code download file.Using the Reporting Services Database
Some report developers don't realize that there are two databases that you can use to lookup or analyze reporting services information. It's often useful to write your own reports, based on information stored in these databases.The first database is ReportServer, which is used by the Report Services to store all the information about reports that have been uploaded to the report manager. Information such as the report catalog, settings, and security are all stored within the ReportServer database. The database ReportServerTempDB stores temporary information such as report snapshots, user sessions, and report execution information.
I have three examples of useful reports created from the ReportServer database. The first report is what I call the Report Index. It provides a list of all the items in the reporting services catalog, with links to render each report in the catalog, as shown in Figure 35. This can prove to be useful as it allows your report users to run just one report and get a list of all reports, without having to navigate through the report manager.

Figure 35: The Report Index report
I provide an example Report Index.rdl report as part of the code
download with this article. You'll have to point the report to your ReportServer
database.The second report, Report Usage, is basically a metrics-type report, providing details of reports that are being executed and how many times per month. The ReportServer database contains a table called ExecutionLog that, by default, stores every report execution for 60 days. You can update the setting ExecutionLogDaysKept in table ConfigurationInfo to allow for more than 60 days of execution tracking. Again, you can obtain the Report Usage.rdl file from the download file, and an example of the report is shown in Figure 36.

Figure 36: The Report Usage report
The third report, Report Users, is similar to the Report Usage
report. Report Users report is basically a metrics-type report, providing
details of which users are executing the reports. Again, you can obtain
the Report Users.rdl file from the download file, and an example of the
report is shown in Figure 37.
Figure 37: The Report Users report
You will need to point all the report mentioned in this section to your ReportServer
database. What has SSRS 2008 fixed?
The challenges that I've covered in this article are ones for which I've managed to finds workable solutions. While using SSRS 2005, I've encountered other challenges for which I still have not found viable solutions, without investigating 3rd party tools. An example would be Rich Text formatting. In SSRS 2005 if you wanted to use Rich Text you have three options none of which are natively supported. You could design your own custom control, generate an image, or buy 3rd party controls.With SSRS 2208, Microsoft has itself made some 3rd party acquisitions that have made the report developer's life a little easier. For example, Microsoft acquired Dundas Data Visualization and so new data visualization controls, such as Charts and Gauges, are now built-in to reporting services. Microsoft also acquired the OfficeWriter technology from SoftArtisans, Inc., which added Word export and support for Rich Text.
Within Reporting Services, improvements have been made for report authoring, report processing and rendering, programmability, and architecture. Based on the challenges/solutions discussed in this article, the following issues have been specifically addressed in SSRS 2008:
Merged cell issues – The rich text control alleviates some of the merged cell issues when exporting to Excel. Now, you can have one control with multiple formatting options and expressions.
Report data in Header and Footer – Variables have been introduced into Reporting Services that can be global or scoped to groups. You no longer have to hide controls in the body of your report to get data to display in the header and footer sections of your reports. If you don't want to use variables, you can also now use data directly in the header and footer with certain controls.
Report Pagination and rendering– there have been numerous improvements in this area:
- New properties have been added to allow greater control over how your report is rendered.
- Null values are now explicit giving you more control while working with nulls.
- The Tablix control, basically the Table, Matrix, and List controls rolled into one, has drastically improved report rendering capabilities.
- Visualization improvements for charts and gauges mean they are far superior to the charting capability available out of the box in SSRS 2005
- The CSV rendering extension has been revamped to work differently depending on the purpose of the export, whether it's for Excel or for application consumption. Overlapping report items should no longer give warnings but may get adjusted automatically when rendered. This reduces pagination problems.
http://msdn.microsoft.com/en-us/library/ms170438.aspx
Finally, it's well worth reviewing the list of breaking changes in SSRS 2008, as they may cause some headache and issues in your environment:
http://msdn.microsoft.com/en-us/library/ms143380.aspx
You'll probably uncover most of the issues when deploying and configuring the ReportServer. A lot of the configuration options have been removed and/or consolidated. Most significantly, SSRS 2008 no longer relies on IIS, and instead uses Handlers and Routers to work with HTTP.sys directly.
Summary
SSRS is a very easy-to-use reporting architecture but I know from experience that when issues or challenges arise it can be very frustrating. I hope the solutions covered in this article will aid you in your work with SSRS. Remember; when a challenge arises there is always a solution, though the solution may not always feasible, based on available resources.
Want to More!!!! Source: http://www.simple-talk.com/sql/reporting-services/)