Counter of Festivals

Ashok Blog for SQL Learners and Beginners and Experts

Tuesday 30 August 2016

Msg 945, Level 14, State 2, Line 1 Database 'AdventureWorks' cannot be opened due to inaccessible files or insufficient memory or disk space. See the SQL Server errorlog for details.

Msg 945, Level 14, State 2, Line 1
Database 'AdventureWorks' cannot be opened due to inaccessible files or insufficient memory or disk space.  See the SQL Server errorlog for details.


When you have seen above Error message kindly use following

Select * from Sys.master_files 

to check whether all mdf and ldf file location same or not

do remember sp_helpdb wont work

sp_helpdb 'databasename' would not work. it throws blank data

After that you can see file location is diff that is folder name is changed  so server cant access that file


 so we need to alter that new file location in database


then we need to restart service as see below


then we need to issue following statement to keep intact in log file

alter database AdventureWorks
set Recovery FULL

ALTER DATABASE AdventureWorks
set Recovery simple


now issue use databasename command

use databasename


Thats it

Different Types of Reports in SSRS

Different Types of Reports in SQL Server Reporting Services (SSRS)

With Reporting Services, you can create the following types of reports:
  • Parameterized reports
  • Linked reports
  • Snapshot reports
  • Cached reports
  • Ad hoc reports
  • Clickthrough reports
  • Drilldown reports
  • Drillthrough reports
  • Subreports
Note: A single report can have characteristics from more than one type; for example, snapshot reports can be parameterized, ad hoc reports incorporate clickthrough report functionality due to the report models upon which they are based, and subreports can be linked reports.
Parameterized Reports
A parameterized report uses input values to complete report or data processing. With a parameterized report, you can vary the output of a report based on values that are set when the report runs. Parameterized reports are frequently used for drillthrough reports, linked reports, and subreports, connecting and filtering reports with related data.
Linked Reports
A linked report is a report server item that provides an access point to an existing report. Conceptually, it is similar to a program shortcut that you use to run a program or open a file.
A linked report is derived from an existing report and retains the original's report definition. A linked report always inherits report layout and data source properties of the original report. All other properties and settings can be different from those of the original report, including security, parameters, location, subscriptions, and schedules.
You can create a linked report on the report server when you want to create additional versions of an existing report. For example, you could use a single regional sales report to create region-specific reports for all of your sales territories.
Although linked reports are typically based on parameterized reports, a parameterized report is not required. You can create linked reports whenever you want to deploy an existing report with different settings
Snapshot Reports
A report snapshot is a report that contains layout information and query results that were retrieved at a specific point in time. Unlike on-demand reports, which get up-to-date query results when you select the report, report snapshots are processed on a schedule and then saved to a report server. When you select a report snapshot for viewing, the report server retrieves the stored report from the report server database and shows the data and layout that were current for the report at the time the snapshot was created.
Report snapshots are not saved in a particular rendering format. Instead, report snapshots are rendered in a final viewing format (such as HTML) only when a user or an application requests it. Deferred rendering makes a snapshot portable. The report can be rendered in the correct format for the requesting device or Web browser.
Report snapshots serve three purposes:
  • Report history. By creating a series of report snapshots, you can build a history of a report that shows how data changes over time.
  • Consistency. Use report snapshots when you want to provide consistent results for multiple users who must work with identical sets of data. With volatile data, an on-demand report can produce different results from one minute to the next. A report snapshot, by contrast, allows you to make valid comparisons against other reports or analytical tools that contain data from the same point in time.
  • Performance. By scheduling large reports to run during off-peak hours, you can reduce processing impact on the report server during core business hours.
Cached Reports
A cached report is a saved copy of a processed report. Cached reports are used to improve performance by reducing the number of processing requests to the report processor and by reducing the time required to retrieve large reports. They have a mandatory expiration period, usually in minutes.
Clickthrough Reports
A clickthrough report is a report that displays related data from a report model when you click the interactive data contained within your model-based report. These reports are generated by the report server based on the information contained within the report model. The person who created the model determines which fields are interactive and which fields are returned when a clickthrough report is opened. These field settings cannot be changed in the report authoring tools.
Clickthrough reports are autogenerated. However, you can create an alternative customized report to the model for interactive data items that is displayed instead. The custom report is a standard Reporting Services report.
Drilldown Reports
Drilldown reports initially hide complexity and enable the user to toggle conditionally hidden report items to control how much detail data they want to see. Drilldown reports must retrieve all possible data that can be shown in the report.
For reports with large amounts of data, consider drillthrough reports instead.
Drillthrough Reports
Drillthrough reports are standard reports that are accessed through a hyperlink on a text box in the original report. Drillthrough reports work with a main report and are the target of a drillthrough action for a report item such as placeholder text or a chart. The main report displays summary information, for example in a matrix or chart. Actions defined in the matrix or chart provide drillthrough links to reports that display greater details based on the aggregate in the main report. Drillthrough reports can be filtered by parameters, but they do not have to be. Drillthrough reports differ from subreports in that the report does not display within the original report, but opens separately. They differ from clickthrough reports in that they are not autogenerated from the data source, but are instead custom reports that are saved on the report server. They differ from drilldown reports in that they retrieve the report data only for the specified parameters or for the dataset query.
Subreports
A subreport is a report that displays another report inside the body of a main report. Conceptually, a subreport is similar to a frame in a Web page. It is used to embed a report within a report. Any report can be used as a subreport. The subreport can use different data sources than the main report. The report that the subreport displays is stored on a report server, usually in the same folder as the parent report. You can set up the parent report to pass parameters to the subreport.
Although a subreport can be repeated within data regions using a parameter to filter data in each instance of the subreport, subreports are typically used with a main report as a briefing book or as a container for a collection of related reports.
For reports with many instances of subreports, consider using drillthrough reports instead. 

Ref:
http://www.venkateswarlu.co.in/MSBI/ssrs/types_of_reports_in_ssrs.aspx 

Parameterized Reports
 

A parameterized report uses input values to complete report or data processing. With a parameterized report, you can vary the output of a report based on values that are set when the report runs. Parameterized reports are frequently used for drillthrough reports, linked reports, and subreports, connecting and filtering reports with related data.

Using Parameters

Parameters are used in dataset queries to select report data, to filter the result set that the query returns, or to set layout properties used to display or hide parts of a report. You can also specify cascading parameters that populate a series of dependent, drop-down parameter lists. For example, a drop-down list of Region parameter values can be used to populate a drop-down list of City parameter values.
You can use parameters with linked reports by pairing a specific parameter with each linked report to change the outcome. For example, you can create a single regional sales report that shows the sales for all regions, and then use a parameter for each linked report to filter data for a particular region. Specific parameter values can be stored with the report so that users do not have to type values.
Not all parameters may be visible in the report at run time. A report author, report server administrator, or content manager can specify which values to use and then hide the input fields on the report.

Query Parameters and Report Parameters

Reporting Services supports two kinds of parameters: query parameters and report parameters. Query parameters are used during data processing to select or filter data. Query parameters are specified in the syntax of a data processing extension. If a query parameter is specified, a value must be provided either by the user or by default properties to complete the SELECT statement or stored procedure that retrieves data for a report. Report parameters are used during report processing to show a different aspect of the data. A report parameter is usually used to filter a large set of records, but it can have other uses depending on the queries and expressions used in the report. Report parameters differ from query parameters in that they are defined in a report and processed by the report server, while query parameters are defined as part of the dataset query and processed on the database server.
To add Report Parameter:
  1. For adding Parameters to Report move your cursor towards Menu and clicks on Report Menu.
  2. Choose Report Parameters Tab.
After adding the Report Parameter we need to set properties of the added parameter. The parameter has following properties, which we have to set.
Parameter Properties:
  • Name - Shows the parameter name and its must be unique name.
  • Data Type – Data Type of Report
  • Prompt - Shows the Display Name for Parameter in Report Viewer Control
The prompt string defines the label that identifies the parameter in the input area. The prompt can be the name of the parameter or directions to the user, for example, "Name" or "Enter Name". If the prompt is left blank and a default parameter value is specified, the default value is used, and the input box for the parameter is not displayed when the user runs the report. If prompt is left blank, and no default parameter value is specified, the report cannot run. If you do not want to prompt the user for parameter values, mark a parameter as Hidden or Internal.
We can have more options to set the parameter behavior. We have more options to set the more properties, which we find in Check Boxes as like following:
  • Hidden
  • Internal
  • Multi Value
  • Allow Null Value
  • Allow Blank Value (Not for Integer Data Type)
Lets see what ways the above properties are useful for parameter while designing the report.
  • Hidden
    By using Hidden Parameter, you can hide the parameter on the parameter input area of the published report, yet set values for it on a report URL or in a subscription definition.
  • Internal
    If you set a parameter to Internal, it is not exposed in any way except in the report definition. In other words Internal Parameter is a parameter that cannot be changed at runtime. A consumer of a published report will never see this as a parameter.
  • Multi Value
    If you want to display multiple selection then MultiValue parameter is used.
    For e.g. Suppose we want to display list of Employees into Drop Down List Box and allowed user to choose among of the listed, we can set the MultiValue Parameter.
  • Allow NULL Value
    Allow Null Value indicates that the parameter can have null values.
  • Allow Blank Value
    If we want to allow an empty string as a valid value then we have to set this parameter. 
 Matrix Report

Matrix Reports are a special report similar to a pivot table. Matrix reports are not uncommon, and are useful for measuring trends.

By Using Report Wizard

Right Click on the Reports branch of Solution Explorer.

Select Add New Report, then click Next to go past the welcome screen.

Select your shared data source, or create a new one for this report. When you have done so, click the Next button.

Next you will need to enter the query to supply data to the report. I generally recommend using a tool like SQL Server Management Studio refined your query. For this lab enter the following query:

SELECT [FiscalYear]
     , [ProductCategoryName]
     , [ProductSubcategory]
     , [Product]
     , [TotalAmount]
FROM [ContosoRetailDW].[Report].[V_ProductTotalsByYear]

Now the Report Wizard will ask what type of report we want. Since we are creating a matrix report select the Matrix option and click Next to continue.

It is now time to design the layout of our matrix report. Click on FiscalYear, then click on the Columns button to move it into the column area. Next click on ProductCategoryName and click the Rows button. Repeat with ProductSubcategory and Product. Finally, click TotalAmount and put it in the details area by clicking the Details button.

Click Next once your screen is complete.

Now the wizard offers to format the report for you. To do so yourself later, picking generic will leave you with plain black and white, no coloring. For this example, let’s pick Corporate and click Next.

Finally we need to give this report a good name. Let’s enter “Product Total By Year Matrix” and click Finish.

Click the Preview tab to see the result of your work.

Customized Report

Drag a Matrix data region to the design surface, add the fields you want to aggregate, and add the fields you want to group by to the Row Groups or Column Groups panes.

To add a matrix data region, row and column groups, and a field to a report layout

  1. Click the Design tab.
  2. In the Toolbox, click Matrix, and then click on the design surface. Report Designer adds a Matrix data region with two columns and two rows. The left corner of the matrix is aligned to the spot that you clicked.
  3. In the Report Data pane, expand the Sales dataset to display the fields.
  4. Drag the Category field from the Report Data pane to the matrix cell that displays Rows.
    When you drop the field into the cell, the following things happen:
    • The cell displays the field name, known as the field expression, in brackets: [Category].
    • The column header value displays the name of the field.
    • The row handle next to the cell displays a bracket inside the handle that indicates that this row is associated to a group.
    • The Grouping pane displays the row group Category.
  5. Drag the Geography field from the Report Data pane to the matrix cell that displays Columns.
    The column handle displays a bracket for the column group, and the Column Groups pane displays the column group Geography.
  6. Drag the LineTotal field to matrix cell that displays the text Data.
    LineTotal represents a numeric field in the dataset. The cell displays the aggregate expression [Sum(LineTotal)].
To add a nested row group
Drag the Subcat field from the Report Data pane to the Row Groups pane, and drop it under the Category group.

When you drop the field on the Row Groups pane, the following things happen:
  1. In the Row Groups pane, the new group Subcat appears, indented under the parent Category group. This shows a nested parent-child relationship.
  2. A new column is added to the matrix, in between the Category column and the Geography column. The cell in the second row displays the field name that you are grouping by: [Subcat].
  3. The column header cell displays the name of the field.
  4. The row handle for the second row displays two nested brackets inside the handle. This indicates that this row is associated to two nested groups.
To add a nested column group

Drag the CountryRegion field from the Report Data pane to the Column Groups pane and drop it under the Geography group.

When you drop the field on the Column Groups pane, the following things happen:
  1. In the Column Groups pane, the new group CountryRegion appears, indented under the parent Geography group.
  2. A new row is added to the matrix between the Geography row and the data row. The nested column header in the third column of the second row displays the field name that you are grouping by: [CountryRegion].
  3. The column handle for the third column displays two nested brackets inside the handle. This indicates that this column is associated to two nested groups.
To add an adjacent column group
  1. In the Column Groups pane, right-click Geography, point to Add Group, and click Adjacent After. The Tablix Group dialog box opens.
  2. In Group by, from the drop-down list, select [Year].
    Click OK. When you create this group, the following things happen:
    1. A group with the default name Group1 appears in the Column Groups pane as an adjacent group in relation to the Geography group.
    2. A new column is added after the Geography/CountryRegion column on which to display the group values for Year.
  3. Right-click the cell that contains [Sum(LineTotal)], and then click Copy.
  4. Right-click in the adjacent cell in the Year column, and then click Paste. This adds the aggregate expression [Sum(LineTotal)] for the column group based on [Year].
  5. (Optional) Preview the report.
The report displays unformatted values organized by category, subcategory, geography, countryregion, and year. 


Adding drill downs

The drill down functionality in SSRS allows you to have areas of your report that can expand and collapse, much like a tree view.

Create a new report with simple table.

Navigate to the Layout tab and drag a new table control onto the page.

The first thing we need to do is to add a group to the table.

Click the table to highlight it, then right-click on the little box with three horizontal lines in it that appear at the left side of the table at the beginning of detail row.

Select Insert Group. When the Group Dialog appears use =Fields!Region.Value as the expression, so that the report now groups on Region. Now drag the Region field into the first column on the Group row. Next, drag the State, Gender, Category and Population fields into the detail row. Add some formatting, and preview the report.


We've now performed a grouping, but we still have to enable the drilldown.

Click on the table to highlight it. Right-click on the nub that appears, just to the left of the detail row. Select Properties. When the Properties window opens, expand the visibility section. Set the Hidden property to True and set the Toggle Item property to State. The Hidden property determines the state of the row when the report is first run. If we set it to True then the data is collapsed and hidden.

By setting the Toggle Item property to State, when the report is run a little + sign appears next to it when the report is run and it works like a tree view.


Switch to the Preview tab and run the report. Now only the States appear, but you can see the customer in each State by using the tree-style +/- controls.


Listbox & Rectangle in SSRS

Rectangle

A rectangle item can have many different uses. Arectangle is simply used to visually separate a region of the report. It may be used to visually contain other items. If items such as text boxes, grids, and so on are placed into a rectangle, all these items can be moved together by simply moving the rectangle. A rectangle may also be used as a data container for data items and can be related to and repeated with a parent container.

List

A list data region is a data-bound report item that contains a single column of multi-instance data on a report. A list can be used for free-form reports or in conjunction with other data regions. You can define lists that contain any number of report items. A list can be nested within another list to provide multiple groupings of data.

To add a list

  • Open the client report definition (.rdlc) file in graphical design mode.
  • In the Toolbox, click List.
  • On the design surface, drag a box to the size you want the list to be. Alternatively, click the design surface to create a list of fixed size.

To bind data to a list, drag a field from the Data Sources window onto the list. Data in a list can be placed into groups and then sorted. For example, you might group products within product categories within departments and then sort the data in ascending order.

To add a group to a list
  1. Right-click the list, and then click Properties.
  2. On the General tab, click Edit details group. This opens the Details Grouping dialog box.
  3. On the General tab, do the following:
    • In Name, type the name of the group.
    • In Group on, type or select the expressions by which to group the data.
    • (Optional) In Document map label, type or select an expression to use as a document map label.
    • (Optional) If this group is a recursive hierarchy, for Parent group, type or select an expression to use as the recursive group parent.
    • (Optional) Click Page break at start or Page break at end to place a page break at the beginning or end of each group instance.
  4. (Optional) On the Filters tab, select or type expressions by which to filter the data within the group.
  5. (Optional) On the Visibility tab, select the visibility options for the item.
  6. (Optional) On the Data Output tab, select the data output options for the item, and then click OK.


Friday 12 August 2016

Fix Orphan users Manually one by one and Bulk Fix


Fix Orphan users Manually one by one and Bulk Fix 

Normally we use below script to fix orphan users one by one

Manual fix one by one:
sp_change_users_login 'report'

sp_change_users_login @Action='update_one', @UserNamePattern='TestA', @LoginName='TestA'

sp_change_users_login @Action='update_one', @UserNamePattern='TestB', @LoginName='TestB'

Bulk fix orphan users:

if you need to fix orphan users more than 10 logins then we have to execute below Script 1

Script 1:

USE master

DROP TABLE tblOrphanUsers

USE master

CREATE TABLE tblOrphanUsers

(username varchar(100),
UserSid varchar(max),
dbname varchar(200) default db_name()
)

/*Create Dynamic SQL to insert all the orphaned users from all the databases into the new table that was created*/

USE master

SELECT 'USE '+ name+ ' INSERT INTO master.dbo.tblOrphanUsers (UserName,UserSID) EXEC sp_change_users_login ''Report'' '

FROM sys.databases
WHERE name not in ('master','msdb','model','distribution','tempdb')
AND name IN ('dbname')
ORDER BY name


Script 2:

SELECT 'USE '+DBname+ ' EXEC sp_change_users_login ''UPDATE_ONE'','''+username+''','''+username+''' '
FROM master.dbo.tblOrphanUsers
where dbname='dbname'

Kindly execute Script 2 and copy output then open new Query window and paste it and execute it.

Script 3:
some times to copy entire logins from Source we can use  sp_helprevlogin
execute it on source and copy output and paste it on Destination and execute it.

script of sp_helprevlogin:

CREATE PROCEDURE sp_help_revlogin @login_name sysname = NULL AS 
DECLARE @name sysname 
DECLARE @type varchar (1) 
DECLARE @hasaccess int 
DECLARE @denylogin int 
DECLARE @is_disabled int 
DECLARE @PWD_varbinary  varbinary (256) 
DECLARE @PWD_string  varchar (514) 
DECLARE @SID_varbinary varbinary (85) 
DECLARE @SID_string varchar (514) 
DECLARE @tmpstr  varchar (1024) 
DECLARE @is_policy_checked varchar (3) 
DECLARE @is_expiration_checked varchar (3) 
 
DECLARE @defaultdb sysname 
 
IF (@login_name IS NULL) 
  DECLARE login_curs CURSOR FOR 
 
      SELECT p.sid, p.name, p.type, p.is_disabled, p.default_database_name, l.hasaccess, l.denylogin FROM  
sys.server_principals p LEFT JOIN sys.syslogins l 
      ON ( l.name = p.name ) WHERE p.type IN ( 'S', 'G', 'U' ) AND p.name <> 'sa' 
ELSE 
  DECLARE login_curs CURSOR FOR 
 
 
      SELECT p.sid, p.name, p.type, p.is_disabled, p.default_database_name, l.hasaccess, l.denylogin FROM  
sys.server_principals p LEFT JOIN sys.syslogins l 
      ON ( l.name = p.name ) WHERE p.type IN ( 'S', 'G', 'U' ) AND p.name = @login_name 
OPEN login_curs 
 
FETCH NEXT FROM login_curs INTO @SID_varbinary, @name, @type, @is_disabled, @defaultdb, @hasaccess, @denylogin 
IF (@@fetch_status = -1) 
BEGIN 
  PRINT 'No login(s) found.' 
  CLOSE login_curs 
  DEALLOCATE login_curs 
  RETURN -1 
END 
SET @tmpstr = '/* sp_help_revlogin script ' 
PRINT @tmpstr 
SET @tmpstr = '** Generated ' + CONVERT (varchar, GETDATE()) + ' on ' + @@SERVERNAME + ' */' 
PRINT @tmpstr 
PRINT '' 
WHILE (@@fetch_status <> -1) 
BEGIN 
  IF (@@fetch_status <> -2) 
  BEGIN 
    PRINT '' 
    SET @tmpstr = '-- Login: ' + @name 
    PRINT @tmpstr 
    IF (@type IN ( 'G', 'U')) 
    BEGIN -- NT authenticated account/group 
 
      SET @tmpstr = 'CREATE LOGIN ' + QUOTENAME( @name ) + ' FROM WINDOWS WITH DEFAULT_DATABASE = [' + @defaultdb + ']' 
    END 
    ELSE BEGIN -- SQL Server authentication 
        -- obtain password and sid 
            SET @PWD_varbinary = CAST( LOGINPROPERTY( @name, 'PasswordHash' ) AS varbinary (256) ) 
        EXEC sp_hexadecimal @PWD_varbinary, @PWD_string OUT 
        EXEC sp_hexadecimal @SID_varbinary,@SID_string OUT 
 
        -- obtain password policy state 
        SELECT @is_policy_checked = CASE is_policy_checked WHEN 1 THEN 'ON' WHEN 0 THEN 'OFF' ELSE NULL END FROM sys.sql_logins WHERE name = @name 
        SELECT @is_expiration_checked = CASE is_expiration_checked WHEN 1 THEN 'ON' WHEN 0 THEN 'OFF' ELSE NULL END FROM sys.sql_logins WHERE name = @name 
 
            SET @tmpstr = 'CREATE LOGIN ' + QUOTENAME( @name ) + ' WITH PASSWORD = ' + @PWD_string + ' HASHED, SID = ' + @SID_string + ', DEFAULT_DATABASE = [' + @defaultdb + ']' 
 
        IF ( @is_policy_checked IS NOT NULL ) 
        BEGIN 
          SET @tmpstr = @tmpstr + ', CHECK_POLICY = ' + @is_policy_checked 
        END 
        IF ( @is_expiration_checked IS NOT NULL ) 
        BEGIN 
          SET @tmpstr = @tmpstr + ', CHECK_EXPIRATION = ' + @is_expiration_checked 
        END 
    END 
    IF (@denylogin = 1) 
    BEGIN -- login is denied access 
      SET @tmpstr = @tmpstr + '; DENY CONNECT SQL TO ' + QUOTENAME( @name ) 
    END 
    ELSE IF (@hasaccess = 0) 
    BEGIN -- login exists but does not have access 
      SET @tmpstr = @tmpstr + '; REVOKE CONNECT SQL TO ' + QUOTENAME( @name ) 
    END 
    IF (@is_disabled = 1) 
    BEGIN -- login is disabled 
      SET @tmpstr = @tmpstr + '; ALTER LOGIN ' + QUOTENAME( @name ) + ' DISABLE' 
    END 
    PRINT @tmpstr 
  END 
 
  FETCH NEXT FROM login_curs INTO @SID_varbinary, @name, @type, @is_disabled, @defaultdb, @hasaccess, @denylogin 
   END 
CLOSE login_curs 
DEALLOCATE login_curs 
RETURN 0  


Script 4:

To check login sid of master and user database matches or existing or not

USE MASTER
GO
SELECT name as SQLServerLogIn,SID as SQLServerSID FROM sys.syslogins
WHERE [name] = 'loginName'
GO

USE DatabaseName
GO
SELECT name DataBaseID,SID as DatabaseSID FROM sysusers
WHERE [name] = 'Loginname'


Tuesday 9 August 2016

Database Mirroring in SQL Server 2005 across domains

Database Mirroring in SQL Server 2005 across domains

Database mirroring has become a very popular choice for a high availability solution in SQL Server 2005. And while Microsoft recommends using Windows Authentication for anything accessing SQL Server, there are cases where this is a limitation. A typical example would be a non-Microsoft application running on a non-Microsoft platform accessing a SQL Server database. Another would be SQL Servers spread across different geographical locations with no Active Directory to authenticate user access or member servers on different domains with no trust relationships. SQL Server 2005 enables us to configure database mirroring under mixed mode authentication using SQL Server logins with the added security of using certificates.
We will use the Northwind database to demonstrate the process. Remember to change Northwind's database recovery model toFULL before working through the steps below.
Let's call the principal server testServer1, the mirror server testServer2 and witness server testServer3. You can also do this without the witness although this tip will highlight using one.
1) Backup the principal database and restore it on the mirror server 
Perform a FULL and LOG backup for the Northwind database on the principal server.
--Run this on testServer1/principal server  USE master   
GO   
BACKUP DATABASE Northwind    
   
TO DISK = N'D:\DBBackup\NorthwindBackup.bak'   
   
WITH NAME N'Full Database Backup',   
    
INITSTATS 10   
GO   
BACKUP LOG Northwind    
   
TO DISK = N'D:\DBBackup\NorthwindBackupLog.trn'   
   
WITH NAME N'Transaction Log Backup',     
       
STATS 10   
GO  
After the backup has completed, restore it on the mirror server using the WITH NORECOVERY option.
--Run this on testServer2/mirror server  RESTORE DATABASE Northwind   FROM DISK = N'D:\DBBackup\NorthwindBackup.bak'   WITH NORECOVERY 
GO   
RESTORE LOG Northwind   FROM DISK = N'D:\DBBackup\NorthwindBackupLog.trn'   WITH NORECOVERY 
GO 
2) Validate your DNS entries
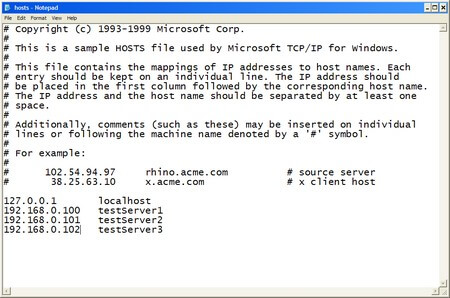
Chances are that you may have your DNS entries for the SQL Server instances properly configured. To validate, do a PING test on both hostnames of the servers running your SQL Server 2005 instances using it's fully qualified domain name (FQDN) in the formhostname.primary DNS suffix. You can retrieve the value of the primary DNS suffix by running an IPCONFIG /ALL in your command line. For servers in workgroups, this could be a bit of a challenge as you might not have a DNS server that would resolve the hostname to their appropriate IP addresses. You would have to modify your hosts file to manually add the IP address-hostname mappings. To do this, open the hosts file on your %systemroot%\system32\drivers\etc\ using any text editor. Enter the IP addresses and hostnames of your principal, mirror and witness servers as shown below
3) Create a database master key on the principal server
--Run this on the principal server/testServer1  USE master  
CREATE MASTER KEY ENCRYPTION BY PASSWORD 'y0ur$ecUr3PAssw0rd';  GO
4) Create the server-based certificate which will be used to encrypt the database mirroring endpoint
--Run this on the principal server/testServer1  CREATE CERTIFICATE testServer1_cert WITH SUBJECT 'testServer1 certificate for database mirroring'  GO 
5) Create the database mirroring endpoint for the principal server using the certificate for authentication
--Run this on the principal server/testServer1  CREATE ENDPOINT Endpoint_Mirroring STATE STARTED AS TCP(LISTENER_PORT 9999LISTENER_IP ALL)  FOR DATABASE_MIRRORING (AUTHENTICATION CERTIFICATE testServer1_cert,  ENCRYPTION REQUIRED ALGORITHM AESROLE ALL);  GO 
This script creates a database mirroring endpoint named Endpoint_Mirroring using port number 9999 and the certificate namedtestServer1_cert. You can use any encryption algorithm available in SQL Server 2005 a described in this Microsoft TechNet article. I just opted to use AES. You can validate that the endpoint has been created by querying the sys.endpoints catalog view
6) Export the certificate to a file
--Run this on the principal server/testServer1  BACKUP CERTIFICATE testServer1_cert TO FILE = 'C:\testServer1_cert.cer';  GO 
7) Copy the certificate file to the mirror and witness server
You need to copy the certificate file to both the mirror and the witness server as we will use this certificate to associate a login for authentication. For this example, all certificates will be copied to the C:\ drive on all servers
Steps #3 to #7 should be repeated on both mirror and witness server, modifying the certificate name while keeping the other configurations.
A complete script for the mirror server is shown below
--Run this on testServer2  

--STEP #3:  
USE master  
CREATE MASTER KEY ENCRYPTION BY PASSWORD 'y0ur$ecUr3PAssw0rd';  GO 
--STEP #4:  CREATE CERTIFICATE testServer2_cert WITH SUBJECT 'testServer2 certificate for database mirroring'  GO  
--STEP #5:  CREATE ENDPOINT Endpoint_Mirroring STATE STARTED  AS TCP(LISTENER_PORT 9999LISTENER_IP ALL)  FOR DATABASE_MIRRORING (AUTHENTICATION CERTIFICATE testServer2_cert,  ENCRYPTION REQUIRED ALGORITHM AESROLE ALL);  GO  
--STEP #6:  BACKUP CERTIFICATE testServer2_cert TO FILE = 'C:\testServer2_cert.cer';  GO 
--STEP #7: Copy the certificate to the principal and witness servers 
A complete script for the witness server is shown below
--Run this on testServer3  

--STEP #3:  
USE master  
CREATE MASTER KEY ENCRYPTION BY PASSWORD 'y0ur$ecUr3PAssw0rd';  GO 
--STEP #4:  CREATE CERTIFICATE testServer3_cert WITH SUBJECT 'testServer3 certificate for database mirroring'  GO  
--STEP #5:  CREATE ENDPOINT Endpoint_Mirroring STATE STARTED  AS TCP(LISTENER_PORT 9999LISTENER_IP ALL)  FOR DATABASE_MIRRORING (AUTHENTICATION CERTIFICATE testServer3_cert,  ENCRYPTION REQUIRED ALGORITHM AESROLE ALL);  GO  
--STEP #6:  BACKUP CERTIFICATE testServer3_cert TO FILE = 'C:\testServer3_cert.cer';  GO 
--STEP #7: Copy the certificate to the principal and mirror servers 
8) Create a login on the principal for the mirror
For simplicity's sake we shall use the same name for the login on all servers to identify that it is used primarily for the database mirroring sessions
--Run this on testServer1 
USE master;  CREATE LOGIN login_mirroring WITH PASSWORD 'y0ur$ecUr3PAssw0rd';  GO 
9) Create a user for the login
--Run this on testServer1 
CREATE USER login_mirroring  FOR LOGIN login_mirroring  
GO 
10) Associate the certificate we created in Step #4 with the user
This script will associate the certificate we created for the mirror server - testServer2_cert.cer - to the user login_mirroring
--Run this on testServer1 
CREATE CERTIFICATE testServer2_cert  AUTHORIZATION login_mirroring  FROM FILE = 'C:\testServer2_cert.cer'  GO 
We'll do the same thing for the certificate we created for the witness server - testServer3_cert.cer - to the user login_mirroring
--Run this on testServer1 
CREATE CERTIFICATE testServer3_cert  AUTHORIZATION login_mirroring  FROM FILE = 'C:\testServer3_cert.cer'  GO 
11) Grant the CONNECT permission on the login
This script will grant the CONNECT permission to the login login_mirroring for the database mirroring endpoint
--Run this on testServer1 
GRANT CONNECT ON ENDPOINT::Endpoint_Mirroring TO [login_mirroring];  GO 
Since we used the same name for the logins on all servers, you only need to do this once. If you are using a different name for the logins, you will have to do this for each login. The key thing to remember here is that the logins you use to connect to any of the SQL Server 2005 instances are granted the CONNECT permissions with the appropriate certificates.
We will do the exact same thing on both the mirror and witness servers.
A complete script for the mirror server is shown below
--Run this on testServer2 

--STEP #8:  
USE master;  CREATE LOGIN login_mirroring WITH PASSWORD 'y0ur$ecUr3PAssw0rd';  GO 
--STEP #9: CREATE USER login_mirroring  FOR LOGIN login_mirroring  
GO 
--STEP #10: CREATE CERTIFICATE testServer1_cert  AUTHORIZATION login_mirroring  FROM FILE = 'C:\testServer1_cert.cer'  GO 
CREATE CERTIFICATE testServer3_cert  AUTHORIZATION login_mirroring  FROM FILE = 'C:\testServer3_cert.cer'  GO 
--STEP #11: GRANT CONNECT ON ENDPOINT::Endpoint_Mirroring TO [login_mirroring];  GO
A complete script for the witness server is shown below
--Run this on testServer3 

--STEP #8:  
USE master;  CREATE LOGIN login_mirroring WITH PASSWORD 'y0ur$ecUr3PAssw0rd';  GO 
--STEP #9: CREATE USER login_mirroring  FOR LOGIN login_mirroring  
GO 
--STEP #10: CREATE CERTIFICATE testServer1_cert  AUTHORIZATION login_mirroring  FROM FILE = 'C:\testServer1_cert.cer'  GO 
CREATE CERTIFICATE testServer2_cert  AUTHORIZATION login_mirroring  FROM FILE = 'C:\testServer2_cert.cer'  GO 
--STEP #11: GRANT CONNECT ON ENDPOINT::Endpoint_Mirroring TO [login_mirroring];  GO
12) Prepare the mirror server for the database mirroring session
This script prepares the mirror database for the database mirroring session, specifying testServer1 as the partner. It is important to run this first on the mirror server before running the equivalent script on the principal server. The hostname specified here should be resolved using the approach you used in Step #2
--Run this on testServer2  USE master  
GO  
ALTER DATABASE Northwind SET PARTNER 'TCP://testServer1:9999';  GO 
13) Prepare the principal server for the database mirroring session
Now that the mirror database has been prepared for the database mirroring session, we will do the same for the principal database specifying testServer2 as the partner.
--Run this on testServer1  USE master  
GO  
ALTER DATABASE Northwind SET PARTNER 'TCP://testServer2:9999';  GO 
We will also specify testServer3 as the witness.
--Run this on testServer1  USE master  
GO  
ALTER DATABASE Northwind SET WITNESS 'TCP://testServer3:9999';  GO 
14) Validate the database mirroring configuration using Database Mirroring Monitor
Run the Database Mirroring Monitor to check the status of the database mirroring sessions.
Ref:
https://www.mssqltips.com/sqlservertip/1705/implementing-database-mirroring-in-sql-server-2005-across-domains/