
SSRS Beginners
SQL SERVER – Installing SQL Server Data Tools and SSRS
If you have installed SQL Server, but are missing the Data Tools or Reporting Services
Double-click the SQL Server 2012 installation media. Click the Installation link on the left to view the Installation options. Click the top link New SQL Server stand-alone installation or add features to an existing installation.

Follow the SQL Server Setup wizard until you get to the Installation Type screen. At that screen, select Add features to an existing instance of SQL Server 2012. Click Next to move to theFeature Selection page. Select Reporting Services – Native and SQL Server Data Tools. If the Management Tools have not been installed, go ahead and choose them as well.

Continue through the wizard and reboot the computer at the end of the installation if instructed to do so.
Configure Reporting Services
If you installed Reporting Services during the installation of the SQL Server instance, SSRS will be configured automatically for you. If you install SSRS later, then you will have to go back and configure it as a subsequent step.
Click Start > All Programs > Microsoft SQL Server 2012 > Configuration Tools > Reporting Services Configuration Manager > Connect on the Reporting Services Configuration Connection dialog box.

On the left-hand side of the Reporting Services Configuration Manager, click Database. Click the Change Database button on the right side of the screen.

Select Create a new report server database and click Next.

Click through the rest of the wizard accepting the defaults. This wizard creates two databases: ReportServer, used to store report definitions and security, and ReportServerTempDB which is used as scratch space when preparing reports for user requests.
Now click Web Service URL on the left-hand side of the Reporting Services Configuration Manager. Click the Apply button to accept the defaults. If the Apply button has been grayed out, move on to the next step. This step sets up the SSRS web service. The web service is the program that runs in the background that communicates between the web page, which you will set up next, and the databases.

The final configuration step is to select the Report Manager URL link on the left. Accept the default settings and click Apply. If the Apply button was already grayed out, this means the SSRS was already configured. This step sets up the Report Manager web site where you will publish reports. You may be wondering if you also must install a web server on your computer. SQL Server does not require that the Internet Information Server (IIS), the Microsoft web server, be installed to run Report Manager.

Click Exit to dismiss the Reporting Services Configuration Manager dialog box.
Now that you are all set with installing SSRS 2008 and some SQL server adventure works database, Let us proceed with creating our first SSRS report, deploying the same and viewing in the web browser. For report development , we will use Microsoft Business Intelligence Development studio. Quite often people ask me, how to install Business intelligence Development studio. Installing business intelligence Development studio, is as simple as adding components to an existing SQL installation. Just run the SQL setup again, and choose add features to an existing installation, and choose select the required features you need.
Lets follow a step by step process to create your first Business Intelligence Report.
Step 1: Open Business Intelligence Development Studio (BIDS) (Start --> Microsoft SQL server 2008 --> SQL server Business Intelligence studio
Step 2: Click File --> New project --> Report Server Project Wizard. Give any name and location.

Step 3: Once you click OK, you will be presented with the following screen.

Step 4 : Click Next. Now configure your connection string. I have chosen the type as 'Microsoft SQL server'

Step 5 : In this step, you need to enter the query for the data, that you need the SSRS report to be populated with. You can also use the query builder.

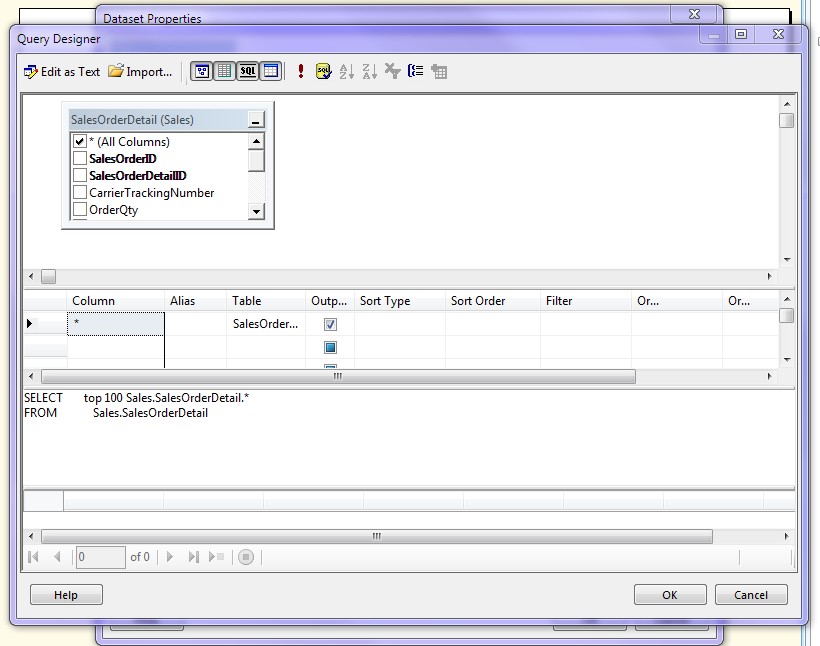
Step 6 : Click on query builder, and click on the right most top icon, to add tables

Step 7: Select the necessary table, and verify your query, then click the (!) icon to see the result of the query after execution.

Step 8: If everything looks good, click on Next

Step 9 : Click Next

Step 10: Add the fields, as shown in the below screenshot.

Step 11 : Click next

Step 12 : Choose a style, and click next.

Step 13 : Choose a deployment location. It will be in the form (http://machinename/Reportserver)

Step 14 : Click Next.

Step 15 : You can preview the report in Business Intelligence Development Studio.

Step 16 : Now, Right click the project , and click deploy.

Step 17 : After successfully deploying the project, open up IE, and hit http://machinename/reports

Step 18 : Click on your report to open it.

Congratulations! You have made your first SSRS report.
Alright, now we have published our first simple SSRS report using the Reporting Wizard. We deployed the report, and viewed it via a web browser. Next, we will understand, how to develop reports, without the custom report creation wizard. This will give much better control, over developing custom reports. (Eg. you need to add custom calculations, embed maps etc.
When you fire up, Microsoft Business Intelligence Development studio - it looks like this.

The Left side portion, is where you set up your data connections, what parameters your report should use, the queries, that return data for your report etc.
The middle portion, is where you actually develop the report. Eg. Setup tabular reports, matrix reports or embed maps, graphics etc
The Right side portion, is called the solution explorer. It lists down all reports (also called RDL's or report definition language) to be displayed. Report definition languages are pure XML file.
Pressing control+Alt+X brings up the toolbox.

Here you see a number of tools, that aid you in your report development. You simply need to drag and drop the tools, that you need in your report, and then configure it accordingly.
We will have a look at some of them in the coming lessons.
Lets proceed towards making a simple SSRS report.
This time, we will not be using the wizard to create our report, but we will make use of the toolbox, and report designer to create our report.
Most of the report development that you do using Microsoft SQL server reporting services, would be using the non-wizard method. This allows more flexibility to your report development.
Step 1: Open Microsoft Business Intelligence studio, and create a report server project.
Step 2: Next lets configure the datasources and datasets.

Step 3: right click on the "Data sources" folder and add a new data source.
Set the connection string to point to your new adventure works database.
Step 4: Once that is done, right click on the datasets folder, to add a dataset.
This is basically the place, where you will configure your query that returns some data, that you want to be displayed in the report.
Select the datasource, that you just created and type in a query.
You could also use the "Query Designer" if you want.

After eveything is done, click ok
Step 5: Now from the toolbox, drag and drop a table control.

Step 6: From the "Report Data", drag and drop the columns defined in the dataset, that you want in the report.

Step 7: That's it, click on the preview tab and congratulations, you have made your first Microsoft SQL server report using a non-wizard method.

Next, lets move on to creating expressions in SQL server reports.
Expressions can be used for a number of things. The best part is that it operates on a cell by cell basis.
Hence, you can write expressions to manipulate the data, or change the properties of cell etc. Even if you are dealing with graphs and maps, many of the properties, you can control using expressions (like color of graph, some values etc).
Basically you would want to write expressions, if you need to manipulate properties/data at runtime
Lets look at a very simple example.
Step 1: Create a report server project and connect to Adventure Works Database.
Step 2: Add the SalesOrderDetail table with a couple of columns to the Report.
Step 3: In the toolbox, add the table control to the report.

Step 4: Add 3 columns to the report - SalesOrderID, SalesOrderDetailID, OrderQty, LineTotal.

Step 5: Now lets write some expressions. We will display anything in LineTotal cell as Green, if the number is above 2000, else we will display in Red.
Right click on the cell , and select text-box properties.


Step 6: Next to the colr dropdown, there is an Fx button.
Write the below expression.

Step 7 : Click OK and then on the Preview button.
You should be getting the final output as displayed below.

Step 8: Now lets write some expressions to manipulate some data.
Right click on the OrderQuantity Cell and click on expressions.
Enter the below expression and click OK.

Step 9: Click on the preview tab, you should get the below output.

I have demonstrated a very simple use of expressions. However , you can write very complex expressions depending on your business needs. For instance, you can write expressions, to calculate the standard deviation of so and so , and manipulate results accordingly.
Many time, you need to write expressions to deal with Dates and times
For information on: http://msdn.microsoft.com/en-us/library/ms157328.aspx
Lets proceed towards making a simple SSRS report with parameters.
This lesson, should give you an idea, as to how to control the data in the reports using parameters.
Lets consider the same report, that we made in Lesson 6.
We are going to expose the postal code as a parameter. This means, we will see the address of only the entered postal code.
Step 1: Modify the query in the dataset, to make PostalCode as a parameter


Step 2: Once you click OK, go to the parameters folder in "Report Data" - you will find that @postalcode automatically appears in the "Parameters" Fields.
Step 3: Lets explore more about the parameter. Double click on @postalcode.
This is place, where you configure, how your parameter should behave - should it allow blank values or null values etc.
You can configure the visibility, data-types, default values etc.
Lets leave it as it is for now.

Step 4: Click preview, and enter in a postal code (91370 for example)

Note: Observe that the parameter appears as a text box here.
If you want pre-configured values (in a dropdown), double click on the parameter in "ReportData" --> Parameters (here, @postalcode) and click "Available Values"/"Default value" and click "Get values from a query". You can choose your dataset and corresponding column. Create multiple datasets to suffice your parameter value requirements.
In this tutorial, lets look at how to format an SSRS report.
SSRS, just like Microsoft word or any other text tool, provides some WYSIWYG editor.
That means at design you can format the text (make it bold, italicize etc).
SSRS also has some ways where-in you can format the display of dates,CURRENCY etc.
etc.
Lets look at some of them in this tutorial.
Step 1:
Create a basic tabular report, using Adventure works database.
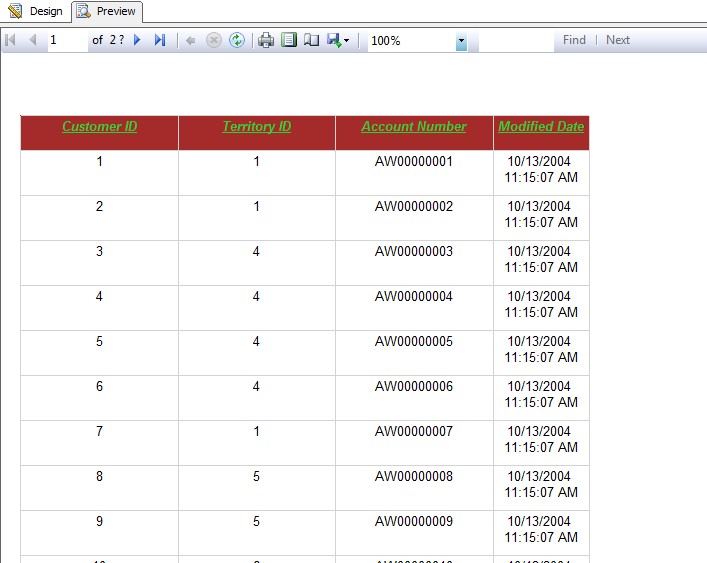
The report would look something like this.

Making the headings bold, Italics, underlined.
Step 2:
In the design view, select the cells in the report, where you want to apply the formatting.
You could either use any of the shortcut keys (like cntrl + B, cntrl + I, cntrl + U) on you can use the icons in the toolbar.

Similarly try adding some background color or text color.
Play around with bullets and numbering.
The same toolbar, also allows you to set the alignment of text.
Step 3:
Some of the features are given in the screenshot below.
Step 5: Once you create a report, using the above query, your report would look something like this.
Step 6: Now lets play around with some Currency formatting and date formatting.
Right click on the unit price cell.
Click on text box properties.
On the left hand pane, click Number --> Currency


SSRS, just like Microsoft word or any other text tool, provides some WYSIWYG editor.
That means at design you can format the text (make it bold, italicize etc).
SSRS also has some ways where-in you can format the display of dates,CURRENCY
Lets look at some of them in this tutorial.
Step 1:
Create a basic tabular report, using Adventure works database.
The report would look something like this.

Making the headings bold, Italics, underlined.
Step 2:
In the design view, select the cells in the report, where you want to apply the formatting.
You could either use any of the shortcut keys (like cntrl + B, cntrl + I, cntrl + U) on you can use the icons in the toolbar.

Similarly try adding some background color or text color.
Play around with bullets and numbering.
The same toolbar, also allows you to set the alignment of text.
Step 3:
Some of the features are given in the screenshot below.
Step 4: Lets explore some other formatting features.
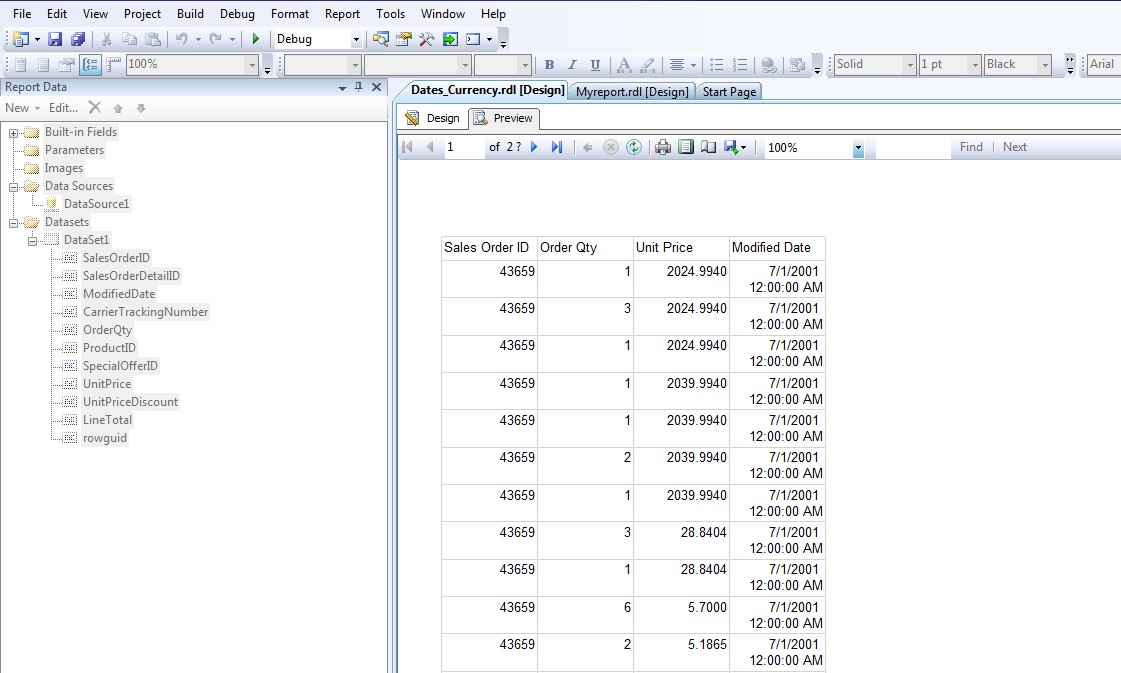
Lets create a report, which has some dates and some CURRENCY.
Preferably you can use the following query from AdventureWorks database.
SELECT TOP (100) *FROM Sales.SalesOrderDetail
Step 5: Once you create a report, using the above query, your report would look something like this.
Step 6: Now lets play around with some Currency formatting and date formatting.
Right click on the unit price cell.
Click on text box properties.
On the left hand pane, click Number --> Currency

Step 7: Now lets do some formatting for dates.
Right click on ModifiedDate --> Number --> Date

Step 8: After choosing your MONEY and date format, click preview and report should look something like this.

Many times we need to group the data in order to drill down further.
To put it simply, imagine you have a report which gives you sales amount for each of the continent.
You might want to drill down into each of these continents and see the sales amount for each country in the continent.
Next, you might want to drill down further to see the sales amount for each state in a country.
Next you might want to drill down from yearly sales to say quaterly...and so on a so forth.
This is where we introduce Groups and drill downs If you have used the Group By clause, for aggregation, you might know, what I am talking about.
In any case, lets take an example from the adventure works database.
Lets consider 4 tables from AdventureWorks 2008 R2
1. Fact Internet Sales
2. DimDate
3. DimSalesTerritory
4. DimProduct
5. DimCustomer.
If you run the below query in SQL Server, you will get the following:
Query:
SELECT D.CalendarYear AS [Year]
,D.CalendarQuarter AS [Quarter]
,D.EnglishMonthName AS [Month]
,D.FullDateAlternateKey AS [Date]
,B.EnglishProductName AS [ProductName]
,C.FirstName + ' ' + LastName AS [CustomerName]
,ST.SalesTerritoryRegion AS [SalesRegion]
,ST.SalesTerritoryCountry AS [SalesCountry]
,A.SalesOrderNumber AS [OrderNumber]
,A.SalesAmount
FROM FactInternetSales A
JOIN DimProduct B
ON B.ProductKey = A.ProductKey
JOIN DimCustomer C
ON C.CustomerKey = A.CustomerKey
JOIN DimDate D
ON D.DateKey = A.OrderDateKey
JOIN DimSalesTerritory ST
ON ST.SalesTerritoryKey = A.SalesTerritoryKey
Now we have some data with us to work with.
Lets use this data in our report and group the data.
Then we will introduce drill through in our reports.
Step 1: Make a report, with a table control by dragging and dropping CustomerName, OrderNumber and SalesAmount.
Hit preview - Your report should look something like this.

Step 2:
Now lets Add a product name, and lets put the customer Name, order number and Sales Amount under it.
Right click on the grouping area --> Add group --> Parent Group --> Group by 'Product Name' (Also Add a group header)

Hit preview. Your report should look something like this.

So lets add more groupings.
Year--Quarter--Month--Date--SalesRegion--SalesCountry--ProductName-Details
So your design view should look something like this:

And your output should look something like this:

To put it simply, imagine you have a report which gives you sales amount for each of the continent.
You might want to drill down into each of these continents and see the sales amount for each country in the continent.
Next, you might want to drill down further to see the sales amount for each state in a country.
Next you might want to drill down from yearly sales to say quaterly...and so on a so forth.
This is where we introduce Groups and drill downs If you have used the Group By clause, for aggregation, you might know, what I am talking about.
In any case, lets take an example from the adventure works database.
Lets consider 4 tables from AdventureWorks 2008 R2
1. Fact Internet Sales
2. DimDate
3. DimSalesTerritory
4. DimProduct
5. DimCustomer.
If you run the below query in SQL Server, you will get the following:
Query:
SELECT D.CalendarYear AS [Year]
,D.CalendarQuarter AS [Quarter]
,D.EnglishMonthName AS [Month]
,D.FullDateAlternateKey AS [Date]
,B.EnglishProductName AS [ProductName]
,C.FirstName + ' ' + LastName AS [CustomerName]
,ST.SalesTerritoryRegion AS [SalesRegion]
,ST.SalesTerritoryCountry AS [SalesCountry]
,A.SalesOrderNumber AS [OrderNumber]
,A.SalesAmount
FROM FactInternetSales A
JOIN DimProduct B
ON B.ProductKey = A.ProductKey
JOIN DimCustomer C
ON C.CustomerKey = A.CustomerKey
JOIN DimDate D
ON D.DateKey = A.OrderDateKey
JOIN DimSalesTerritory ST
ON ST.SalesTerritoryKey = A.SalesTerritoryKey

Now we have some data with us to work with.
Lets use this data in our report and group the data.
Then we will introduce drill through in our reports.
Step 1: Make a report, with a table control by dragging and dropping CustomerName, OrderNumber and SalesAmount.
Hit preview - Your report should look something like this.

Step 2:
Now lets Add a product name, and lets put the customer Name, order number and Sales Amount under it.
Right click on the grouping area --> Add group --> Parent Group --> Group by 'Product Name' (Also Add a group header)

Hit preview. Your report should look something like this.

So lets add more groupings.
Year--Quarter--Month--Date--SalesRegion--SalesCountry--ProductName-Details
So your design view should look something like this:

And your output should look something like this:
