Counter of Festivals

Ashok Blog for SQL Learners and Beginners and Experts

Monday, 12 August 2019

How to install SQL Server 2017 with Docker

---------------Docker with SQL-------------


Docker commands:

docker run -d -p 8080:1433 --name docker_sql2017 -e sa_password=Test123456test -e ACCEPT_EULA=Y microsoft/mssql-server-windows-developer:2017-latest

To See docker images:

docker images

For ex:

PS C:\Users\usename> docker images

To see docker all containers:

docker ps -a

To see docker container ip address:

docker inspect -f "{{range .NetworkSettings.Networks}}{{.IPAddress}}{{end}}" containername

docker inspect -f "{{range .NetworkSettings.Networks}}{{.IPAddress}}{{end}}" docker_sql2017

To see logs of container:

Docker container logs containername

Docker container logs docker_sql2017

To login to the sql cmd:

PS C:\Users\jar> sqlcmd -U sa -S Ipaddressofserver(which we got from inspect command above)

PS C:\Users\jar> sqlcmd -U sa -S 172.31.240.15

Once logeed into to we can see version and servername as below

PS C:\Users\jar> sqlcmd -U sa -S 172.31.240.15
Password:Test123456test
1> go
1> select @@version
2> go
1> select @@servername
2> go

To create loginname with sysadmin as below:

1> create login testlogin with password='test@123';
2> go
1>
2> exec master..sp_addsrvrolemember @loginame='testlogin',@rolename='sysadmin';
3> go

Now we can go with loginto the SSMS as see below

Servername: Ipaddress,portno

Ex:
172.31.240.15,1433

Username:testlogin
Password:test@123
-------------------------------------------------------

ref:


https://www.digitalocean.com/community/tutorials/how-to-remove-docker-images-containers-and-volumes


Purging All Unused or Dangling Images, Containers, Volumes, and Networks

Docker provides a single command that will clean up any resources — images, containers, volumes, and networks — that are dangling (not associated with a container):
  • docker system prune
To additionally remove any stopped containers and all unused images (not just dangling images), add the -a flag to the command:
  • docker system prune -a

Removing Docker Images

Remove one or more specific images

Use the docker images command with the -a flag to locate the ID of the images you want to remove. This will show you every image, including intermediate image layers. When you've located the images you want to delete, you can pass their ID or tag to docker rmi:
List:
  • docker images -a
Remove:
  • docker rmi Image Image

Remove dangling images

Docker images consist of multiple layers. Dangling images are layers that have no relationship to any tagged images. They no longer serve a purpose and consume disk space. They can be located by adding the filter flag, -f with a value of dangling=true to the docker imagescommand. When you're sure you want to delete them, you can use the docker images purgecommand:
Note: If you build an image without tagging it, the image will appear on the list of dangling images because it has no association with a tagged image. You can avoid this situation by providing a tagwhen you build, and you can retroactively tag an images with the docker tag command.
List:
  • docker images -f dangling=true
Remove:
  • docker images purge

Removing images according to a pattern

You can find all the images that match a pattern using a combination of docker images and grep. Once you're satisfied, you can delete them by using awk to pass the IDs to docker rmi. Note that these utilities are not supplied by Docker and are not necessarily available on all systems:
List:
  • docker images -a | grep "pattern"
Remove:
  • docker images -a | grep "pattern" | awk '{print $3}' | xargs docker rmi

Remove all images

All the Docker images on a system can be listed by adding -a to the docker images command. Once you're sure you want to delete them all, you can add the -q flag to pass the Image ID to docker rmi:
List:
  • docker images -a
Remove:
  • docker rmi $(docker images -a -q)

Removing Containers

Remove one or more specific containers

Use the docker ps command with the -a flag to locate the name or ID of the containers you want to remove:
List:
  • docker ps -a
Remove:
  • docker rm ID_or_Name ID_or_Name

Remove a container upon exit

If you know when you’re creating a container that you won’t want to keep it around once you’re done, you can run docker run --rm to automatically delete it when it exits.
Run and Remove:
  • docker run --rm image_name

Remove all exited containers

You can locate containers using docker ps -a and filter them by their status: created, restarting, running, paused, or exited. To review the list of exited containers, use the -f flag to filter based on status. When you've verified you want to remove those containers, using -q to pass the IDs to the docker rm command.
List:
  • docker ps -a -f status=exited
Remove:
  • docker rm $(docker ps -a -f status=exited -q)

Remove containers using more than one filter

Docker filters can be combined by repeating the filter flag with an additional value. This results in a list of containers that meet either condition. For example, if you want to delete all containers marked as either Created (a state which can result when you run a container with an invalid command) or Exited, you can use two filters:
List:
  • docker ps -a -f status=exited -f status=created
Remove:
  • docker rm $(docker ps -a -f status=exited -f status=created -q)

Remove containers according to a pattern

You can find all the containers that match a pattern using a combination of docker ps and grep. When you're satisfied that you have the list you want to delete, you can use awk and xargs to supply the ID to docker rmi. Note that these utilities are not supplied by Docker and not necessarily available on all systems:
List:
  • docker ps -a | grep "pattern”
Remove:
  • docker ps -a | grep "pattern" | awk '{print $3}' | xargs docker rmi

Stop and remove all containers

You can review the containers on your system with docker ps. Adding the -a flag will show all containers. When you're sure you want to delete them, you can add the -q flag to supply the IDs to the docker stop and docker rm commands:
List:
  • docker ps -a
Remove:
  • docker stop $(docker ps -a -q)
  • docker rm $(docker ps -a -q)

Removing Volumes

Remove one or more specific volumes - Docker 1.9 and later

Use the docker volume ls command to locate the volume name or names you wish to delete. Then you can remove one or more volumes with the docker volume rm command:
List:
  • docker volume ls
Remove:
  • docker volume rm volume_name volume_name

Remove dangling volumes - Docker 1.9 and later

Since the point of volumes is to exist independent from containers, when a container is removed, a volume is not automatically removed at the same time. When a volume exists and is no longer connected to any containers, it's called a dangling volume. To locate them to confirm you want to remove them, you can use the docker volume ls command with a filter to limit the results to dangling volumes. When you're satisfied with the list, you can remove them all with docker volume prune:
List:
  • docker volume ls -f dangling=true
Remove:
  • docker volume prune

Remove a container and its volume

If you created an unnamed volume, it can be deleted at the same time as the container with the -vflag. Note that this only works with unnamed volumes. When the container is successfully removed, its ID is displayed. Note that no reference is made to the removal of the volume. If it is unnamed, it is silently removed from the system. If it is named, it silently stays present.
Remove:
  • docker rm -v container_name

Thursday, 25 July 2019

The operation could not be performed because OLE DB provider “SQLNCLI11” for linked server was unable to begin a distributed transaction.


Issue:
When we tried to update table data, which uses triggers with linked servers
It will through error.


Solution:

To resolve this we should need to configure DTC(Distributed Transaction Coordinator)  Settings like below in both Source and Destination
RUN------------> dcomcnfg.exe
Expand "Component Services"
Expand "computers" >
Expand "My computer"
Expand "DTC"
Right click on the server and make the same config as below step for the "local DTC"
Place a check in the Network DTC Access and the Allow Inbound and Allow Outbound under the Transaction Manager Communication option.  We also selected No Authentication Required, as this was the way the other servers in the environment were configured.

Restart the DTC services from Services.msc


We should need to same config on source and destination
Issue fixed now

We can update data using linked server inside triggers as see below


Friday, 5 July 2019

Troubleshooting - Getting error A four-part name was supplied, but the provider does not expose the necessary interfaces to use a catalog or schema.

[QODBC-ALL] Troubleshooting - Getting error A four-part name was supplied, but the provider does not expose the necessary interfaces to use a catalog or schema.

Troubleshooting - Getting error A four-part name was supplied, but the provider does not expose the necessary interfaces to use a catalog or schema.

Problem Description:

I am using QODBC to fetch QuickBooks Data in SQL Server. I have created Linked Server in SQL Server.

We are receiving the following error when trying to fetch data.

The SQL is:
SELECT * FROM [QREMOTE].[QODBC]..[Company]

The error is:
Msg 7399, Level 16, State 1, Line 4
The OLE DB provider "MSDASQL" for linked server "QREMOTE" reported an error. The provider did not give any information about the error.

Msg 7312, Level 16, State 1, Line 4
Invalid use of schema or catalog for OLE DB provider "MSDASQL" for linked server "QREMOTE". A four-part name was supplied, but the provider does not expose the necessary interfaces to use a catalog or schema.

Solution:

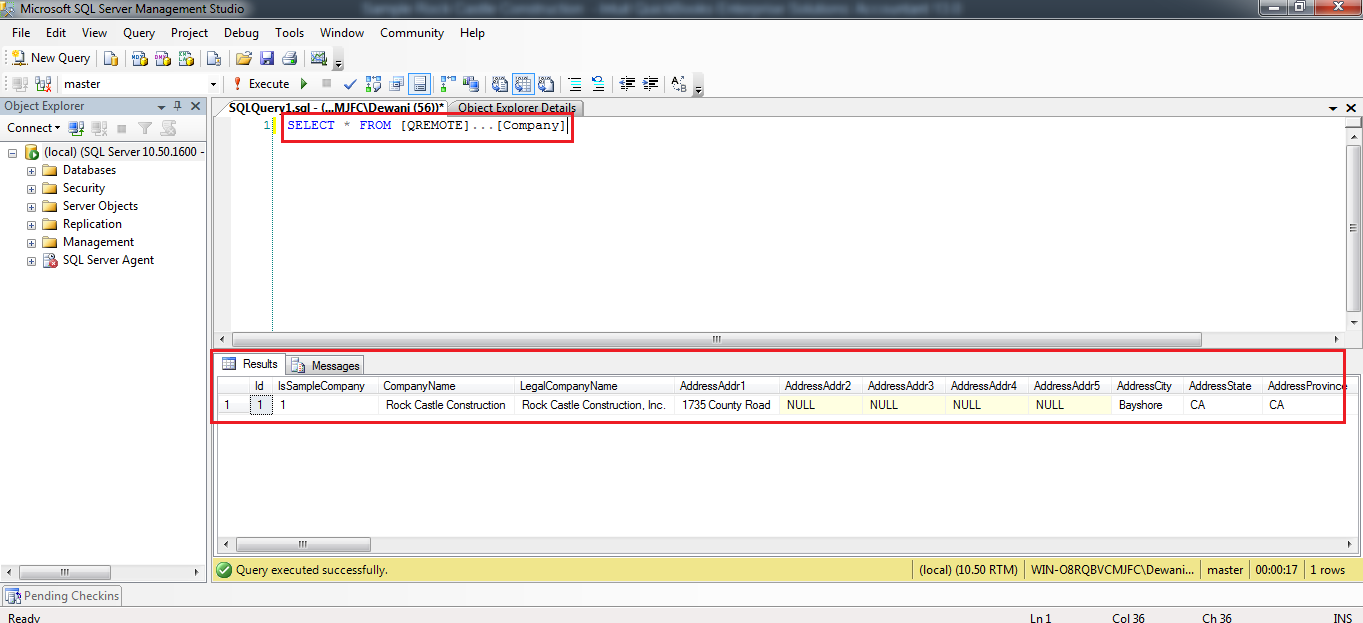
You have used wrong SQL statement. You need to use LinkedServerName & table name in the query.

For Example:
Select * from YourLinkedServerName...TableName
SELECT * FROM [QREMOTE]...[Company]
 

 (0 vote(s))
 Helpful
 Not helpful

Friday, 7 June 2019

Linked Servers displaying local database catalog and not remote database catalog

 SELECT * FROM OPENQUERY(linkedservername, 'SELECT @@servername AS servername')

select * from sys.servers

when we create linked server  datasource should not be blank if blank it will take local server as source

https://social.msdn.microsoft.com/Forums/en-US/be11aa8c-0af6-45b9-b2e2-08b93fca2373/linked-servers-displaying-local-database-catalog-and-not-remote-database-catalog?forum=sqldataaccess

we can verify linked server name as using below query

EXEC sp_addlinkedserver 
   @server=N'linkedservername',             -- Remote Computer Name
   @srvproduct=N'',                 -- Not Needed
   @provider=N'SQLNCLI',            -- SQL Server Driver
   @datasrc=N'servername\instancename';  -- Server Name And Instance

Thursday, 2 May 2019

Database mail queued but not sending even Test Mails in SQL Server

Database mail queued but not sending


Some times Server might be brought on from crash or some reason
that time DB mail might struck not sent mail but queued

To resolve this solution

1) check below query to check status of db mail and even testmails also queued

so fix this issue kindly restart SQL service and SQL agent service to fix this issue

-- This one told me that Database Mail was started
EXEC msdb.dbo.sysmail_help_status_sp;
 
-- Here I learned that there were 5 items queued and the last times I tried sending mail
EXEC msdb.dbo.sysmail_help_queue_sp @queue_type = 'mail';
 
-- This confirmed none of the email was sent
SELECT * FROM msdb.dbo.sysmail_sentitems;
SELECT * FROM msdb.dbo.sysmail_unsentitems;
 
-- Is Service Broker enabled? It has to be to send mail
SELECT is_broker_enabled FROM sys.databases WHERE name = 'msdb';
 
-- I tried stopping and restarting the Database Mail exe
EXEC msdb.dbo.sysmail_stop_sp;
EXEC msdb.dbo.sysmail_start_sp;

Thursday, 21 March 2019

Trouble shoot High CPU spike or High CPU Consumption

to troubleshoot "SQL Server consuming High CPU" and few checklist points which will help in isolating/troubleshooting.
Below screenshot summarizes an approach to isolate SQL high CPU issues:
CHECKLIST POINTS:
1. From Windows task manager check the overall CPU utilization. Collect the details of number of logical processors present on the box.

2. From task manager, check the SQL Server process CPU utilization. Is the SQL CPU constantly above 70%?

3. Gather the following details:
  • How do you typically become aware that CPU is the bottleneck?
  • What is the impact of the problem? Are there particular errors that your user application?
  • When did the problem first occur? Are you aware of anything that changed around this time? (Increased workload? Change in table size? App upgrade? SQL upgrade?)
  • Can you make new connections to the server during the problem period?
  • How long did the problem last? Have you been able to do anything that seemed to help resolve the problem?
  • What system-level symptoms have you observed during the problem periods? For example, is the server console slow or unresponsive during the problem periods? Does overall CPU usage increase? If so, what %CPU is observed during the problem? What is the expected %CPU?

4. If the High CPU is causing by process other than SQL Server process (sqlservr.exe) engage the team which takes care of that process.

5. Open Perfmon and add the below counters:
Process (sqlservr):
% Privileged Time
% Processor Time
% User Time
Processor
% Privileged Time
% Processor Time
% User Time

6. If Processor Privileged time is above 25%, engage the Windows team
Processor Time = Privileged Time + User Time.

7.  Confirm that SQL is consuming high CPU on the box by validating the below counters:
Process (sqlservr): % Privileged Time
% Processor Time
% User Time
Divide the value observed with the number of logical processors to get the CPU utilization by SQL Process.
If (Process (sqlservr)% Privileged time/No of Procs) is above 30%, ensure that KB 976700 is applied for Windows 2008 R2

This step, gives an indication of if SQL Server is causing the high privilege time on the server. If SQL privilege time is high, as per the above calculations, engage the Windows team.

8. Check the below configurations from sp_configure and make sure they are as per the best practice recommendations:
Follow KB 2806535 for Max DOP recommendation settings.

9. If you are unable to connect to the SQL instance locally using SSMS, try connecting to SQL instance using Dedicated Admin connection (DAC) using:
ADMIN: Servername

10. Get the top 10 queries consuming High CPU using below query:
SELECT s.session_id,
r.status,
r.blocking_session_id 'Blk by',
r.wait_type,
wait_resource,
r.wait_time / (1000 * 60) 'Wait M',
r.cpu_time,
r.logical_reads,
r.reads,
r.writes,
r.total_elapsed_time / (1000 * 60) 'Elaps M',
Substring(st.TEXT,(r.statement_start_offset / 2) + 1,
((CASE r.statement_end_offset
WHEN -1
THEN Datalength(st.TEXT)
ELSE r.statement_end_offset
END - r.statement_start_offset) / 2) + 1) AS statement_text,
Coalesce(Quotename(Db_name(st.dbid)) + N'.' + Quotename(Object_schema_name(st.objectid, st.dbid)) + N'.' +
Quotename(Object_name(st.objectid, st.dbid)), '') AS command_text,
r.command,
s.login_name,
s.host_name,
s.program_name,
s.last_request_end_time,
s.login_time,
r.open_transaction_count
FROM sys.dm_exec_sessions AS s
JOIN sys.dm_exec_requests AS r
ON r.session_id = s.session_id
CROSS APPLY sys.Dm_exec_sql_text(r.sql_handle) AS st
WHERE r.session_id != @@SPID
ORDER BY r.cpu_time desc

11.  Check the wait type of the queries returned from the above output. If CPU is the major bottleneck, most of the sessions will have the below waits:
SOS_SCHEDULER_YIELD
CXPACKET
THREADPOOL
If most of the queries are waiting on CXPACKET, revisit sp_configure setting for “Max degree of parallelism” and “Cost degree of parallelism” and check if they are set as per best practice recommendations.

12.  Run the SQL Standard report to get the list of Top CPU queries:
Right Click on the instance, go to reports> Standard reports
Check the Top CPU queries obtained in the report. Compare the report with the Top CPU consuming queries obtained from above step.

13.  Once the top CPU queries are identified, get the list of all the SQL tables involved using statement_text and command_text column output obtained from step 10.
Check the following:
Index Fragmentation on the top CPU driving tables
Last Statistics updated information
If the Index fragmentation is above >30 %, rebuild the index. If the statistics are not updated on the table, update the statistics.
From the Top CPU queries, if there are only few set of tables which are responsible for high CPU, share the tables list with the application team and share the statistics report and fragmentation report.
Check if there are any select queries which are causing high CPU, check with application team if they can be stopped temporarily on high OLTP servers.


14.  Once the database maintenance activity is performed (like Index rebuild and Stats update), if SQL is still using high CPU, execute the query mentioned in Step 10.
Check if the Top CPU query has changed. If the query has changed, then follow the action mentioned in Step 13. If the query is still the same, then go to next step.

15. Collect the estimated execution plan of the top CPU consuming queries involved using:
Query 1:  Get the Top CPU consuming session ID’s from the output of query mentioned in step 10.
Collect the Plan handle and SQL handle information from below query:
select sql_handle,plan_handle from sys.dm_exec_requests where session_id=<session_id>
Get the text of the query:
--replace the SQL Handle with the value obtained from above query.
select * from sys.dm_exec_sql_text (sql_handle)
Get the estimated execution plan of the query:
--replace the Plan handle with the value obtained from above query.
select * from sys.dm_exec_query_plan (plan_handle)
Query 2: The below query captures the Total CPU time spend by a query along with the plan handle. Plan handle of the query is needed to get the estimated execution of the query.
select
highest_cpu_queries.plan_handle,
highest_cpu_queries.total_worker_time,
q.dbid,
q.objectid,
q.number,
q.encrypted,
q.
from
(select top 50
qs.plan_handle,
qs.total_worker_time
from
sys.dm_exec_query_stats qs
order by qs.total_worker_time desc) as highest_cpu_queries
cross apply sys.dm_exec_sql_text(plan_handle) as q
order by highest_cpu_queries.total_worker_time desc

16.  Share the estimated execution plan obtained with the application team.
Check for the operator which has high Cost.
Check the Indexes used for the operator and number of rows estimated.
Revisit the statistics and Indexes on the table reported for the operator which has high cost and make sure that there are no stale statistics.
Check if the estimated execution plan is recommending any new index to be created. If the plan reports an index recommendation, share the missing index details with the Application team.

17.  “Convert Implicit” function in execution plan can result in High CPU utilization of SQL Server as well.
Review the execution plans of the High CPU consuming queries and review the Operator with High Cost and check if there are any Convert_Implicit function is called.
In the above screenshot, CONVERT_IMPLICIT function is implicitly converting the column “NationalIDNumber” to integer whereas in the table definition its defined as nvarchar (15). So, share the report with application team and ensure that the data type passed and stored in database are having the same data type.

18.  Run the missing index query on the database which has reported high CPU and check if there are any missing indexes recommendations. Share the Index recommendation report with the Application team

19.  Tune the Top CPU consuming queries with the Database Engine Tuning Adviser to see whether database engine recommends index recommendation/statistics creation.

20.  Check for Compilations/Re-Compilations in SQL Server:
From perfmon, capture the below counters:
SQL Server: SQL Statistics: Batch Requests/sec
SQL Server: SQL Statistics: SQL Compilations/sec
SQL Server: SQL Statistics: SQL Recompilations/sec
Batch Requests/sec: Number of SQL batch requests received by server.
SQL Compilations/sec: Number of SQL compilations per second.
SQL Recompilations/sec: Number of SQL re-compiles per second.

If the recompilation count is high, check for below:
Any Schema changes
Statistics changes
SET option changes in the batch
Temporary table changes
Stored procedure creation with the RECOMPILE query hint or the OPTION (RECOMPILE) query hint
From SQL profiler, add the following events and check the stored procedures which are getting recompiled frequently.
21. Check if SQL System threads are consuming high CPU:
select * from sys.sysprocesses where cmd like 'LAZY WRITER' or cmd like '%Ghost%' or cmd like 'RESOURCE MONITOR'
Ghost cleanup thread >>>> Check if the user deleted large number of rows
Lazy Writer thread >>>>>>> Check if any memory pressure on the server
Resource Monitor thread >> Check if any memory pressure on the server

22.  If the Top CPU consuming queries has the wait type: SQLTRACE_LOCK, check there are any traces running on the server using:
select * from sys.traces

23. Collect the PSSDIAG during the Top CPU issue time. Refer KB 830232. Load and Analyze the data in SQL Nexus tool.

24. Even after implementing above action plans, if the SQL CPU utilization is high, then increase the CPU on the server.

script:

--to check index fragmentation report

SELECT dbschemas.[name] as 'Schema',
dbtables.[name] as 'Table',
dbindexes.[name] as 'Index',
indexstats.avg_fragmentation_in_percent,CASE 
        WHEN indexstats.avg_fragmentation_in_percent < 10
            THEN 'NOTHING'
        WHEN indexstats.avg_fragmentation_in_percent >= 10
            AND indexstats.avg_fragmentation_in_percent < 30
            THEN 'REORGANIZE'
        WHEN indexstats.avg_fragmentation_in_percent >= 30
            THEN 'REBUILD'
        END as fragmentation_comments,
indexstats.page_count
FROM sys.dm_db_index_physical_stats (DB_ID(), NULL, NULL, NULL, NULL) AS indexstats
INNER JOIN sys.tables dbtables on dbtables.[object_id] = indexstats.[object_id]
INNER JOIN sys.schemas dbschemas on dbtables.[schema_id] = dbschemas.[schema_id]
INNER JOIN sys.indexes AS dbindexes ON dbindexes.[object_id] = indexstats.[object_id]
AND indexstats.index_id = dbindexes.index_id
WHERE indexstats.database_id = DB_ID() and indexstats.page_count>=1000 and indexstats.avg_fragmentation_in_percent>=10
ORDER BY indexstats.avg_fragmentation_in_percent desc

--To check who is active and logs

use master

select getdate() 'Today Date and Time',@@servername as servername


Exec sp_WhoIsActive


USE master

DECLARE @T table(LogDate datetime,Processinfo char(10),Text Nvarchar(Max))

Insert into @T
EXEC xp_readerrorlog

Select    @@SERVERNAME AS ServerName,* from @T
where Processinfo<>'Backup' and Processinfo<>'Logon'
Order by LogDate desc